If it doesn’t say Kellogg’s on the box…

I recently bought a new Apple MacBook Pro. It’s faster, lighter, cooler, smaller than the one it is replacing, and all connectivity is via USB-C. This is a good thing. Like many, I was skeptical about the usefulness of the Touch Bar, but I’m now convinced.

It wasn’t cheap, but it doesn’t end there. I have been known to leave my power supply at home when visiting customers, so I like to keep a second PSU and leads in my computer bag at all times.

My new MBP has four USB-C ports and uses an 87W USB-C Power Adaptor. At £79, they aren’t cheap either. However, this does not include the required UCB-C Charge Cable, which costs a further £19.

There’s more. The PSU comes with a fused UK BS1363 adaptor. If you want the extension cable that used to be supplied with the previous generation products, that’s extra too.

So, I thought I’d shop around for the best credible deal I could find. But as I’d heard rumours of potentially dangerous, fake, knock-off Apple goods, I thought I’d play it safe by buying from a high street retailer.

I should have just paid the “genuine” price and moved on. Here’s what System Report shows for the PSU and USB-C cable that came “bundled” with the MBP bought from an authorised Apple Premium Reseller in town…

And here’s the same report for the PSU and USB-C cable I bought from an “other” independent computer sales and repair shop in another town…

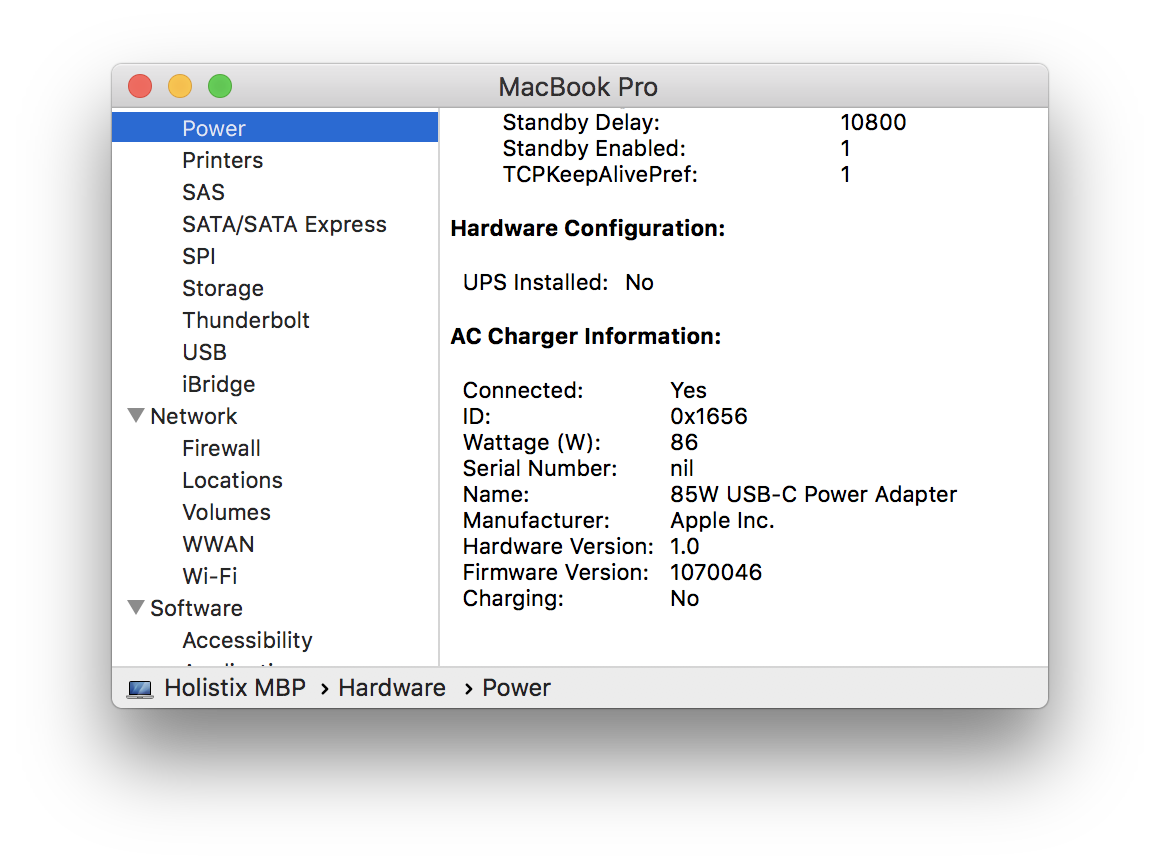
Notice that the products show the same values for ID, Wattage, etc., but different values Serial Number, Name and Firmware Version. Indeed, the “other” PSU appears to have no serial number. More on this in a moment.

The two USB-C cables are the same length, but look and feel very different. With some googling around, I found that Apple had some issues with early versions of the cable

A limited number of Apple USB-C charge cables that were included with MacBook computers through June 2015 may fail due to a design issue. As a result, your MacBook may not charge or only charge intermittently when it’s connected to a power adapter with an affected cable.

Affected cables have “Designed by Apple in California. Assembled in China.” stamped on them. New, redesigned cables include a serial number after that text.

Here’s the printing stamped on my two cables (“bundled” left, “other”, right) …

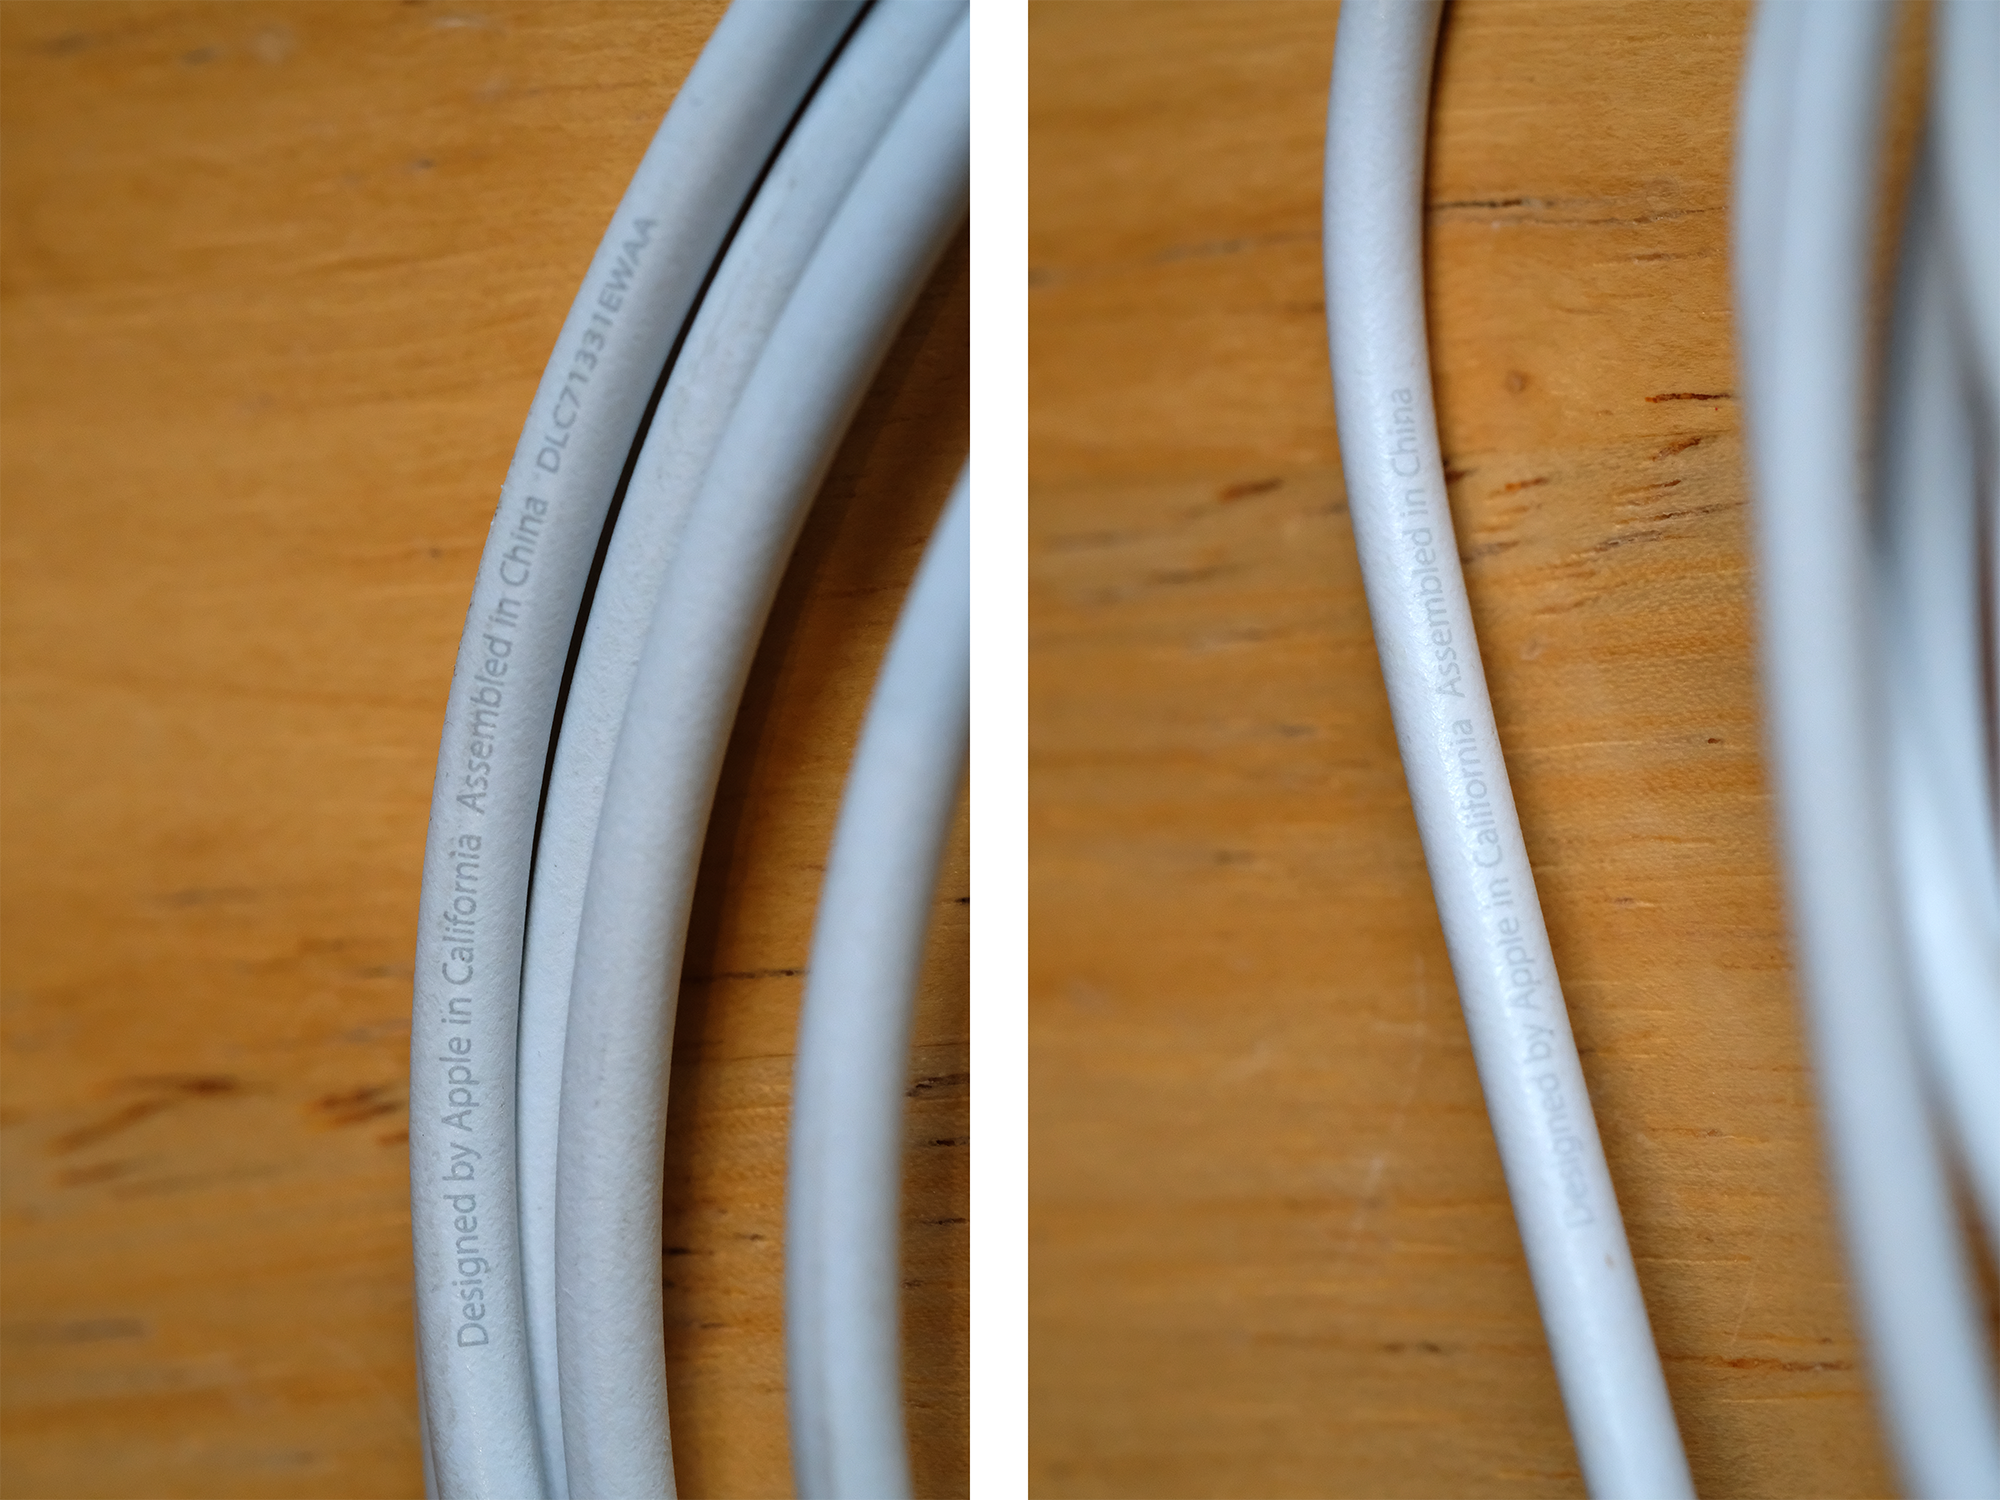
So, at best the “other” cable is one of the ones which Apple would have recalled. But how else do they differ? Here’s what they look like, and how they weigh-in (again, “bundled” left, “other”, right) …

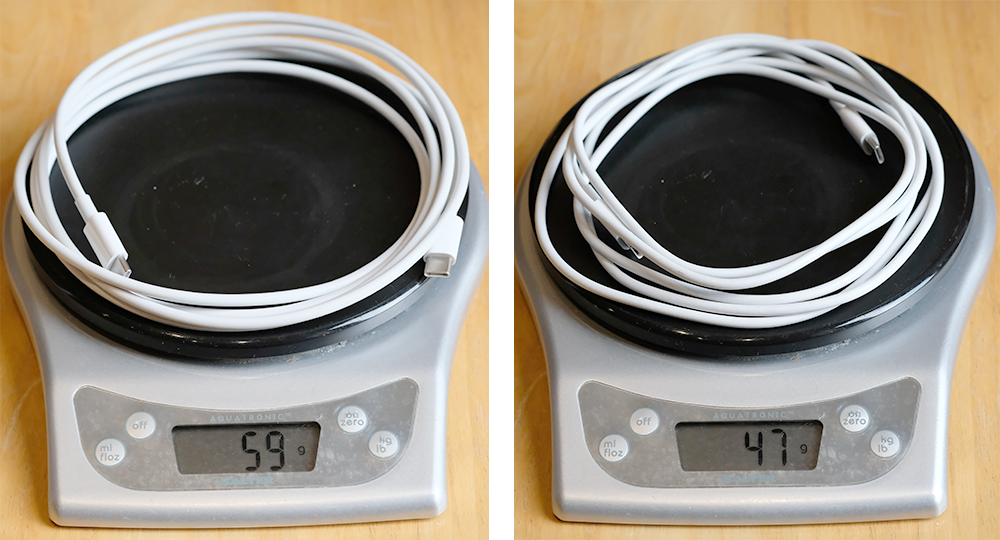
Although the cables are the same length, the “bundled” cable is thicker, heavier, and coils more tidily. But does this matter?

Well, some products sold as “genuine” certainly seem to matter in Apple . In October 2016, they filed a lawsuit after finding that 90% of 1000 “genuine” chargers they had bought from Amazon were fake. It also mattered to a blogger who nearly set his hotel room on fire with a fake charger.

Remember that both solutions claim to supply 86 Watts? Presumably the “other” cable is lighter because it has less metal. So is it actually able to safely supply 86 Watts all day and all night long? My “bundled” PSU doesn’t think so …

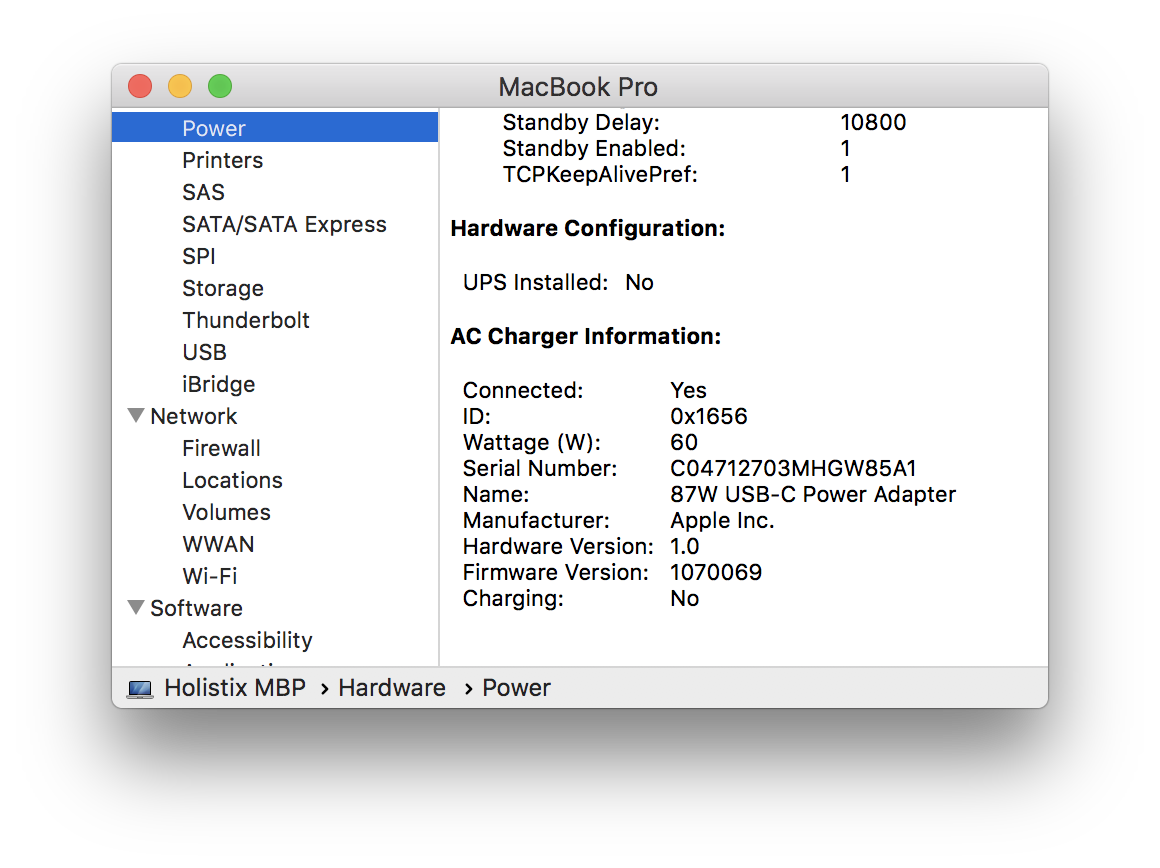
With the “bundled” PSU the MBP limits the current to 60 Watts with the “other” cable. This is beginning to sound like a good idea. Indeed, apart from generating the above screen grabs, I haven’t been using the “other” PSU or cable at all.

So, how can you tell that you’ve got a “genuine” Apple PSU? Well, without opening them, up (and voiding the warranty) it’s hard to tell, though someone has done so for other models.

But there are other ways to tell them apart …

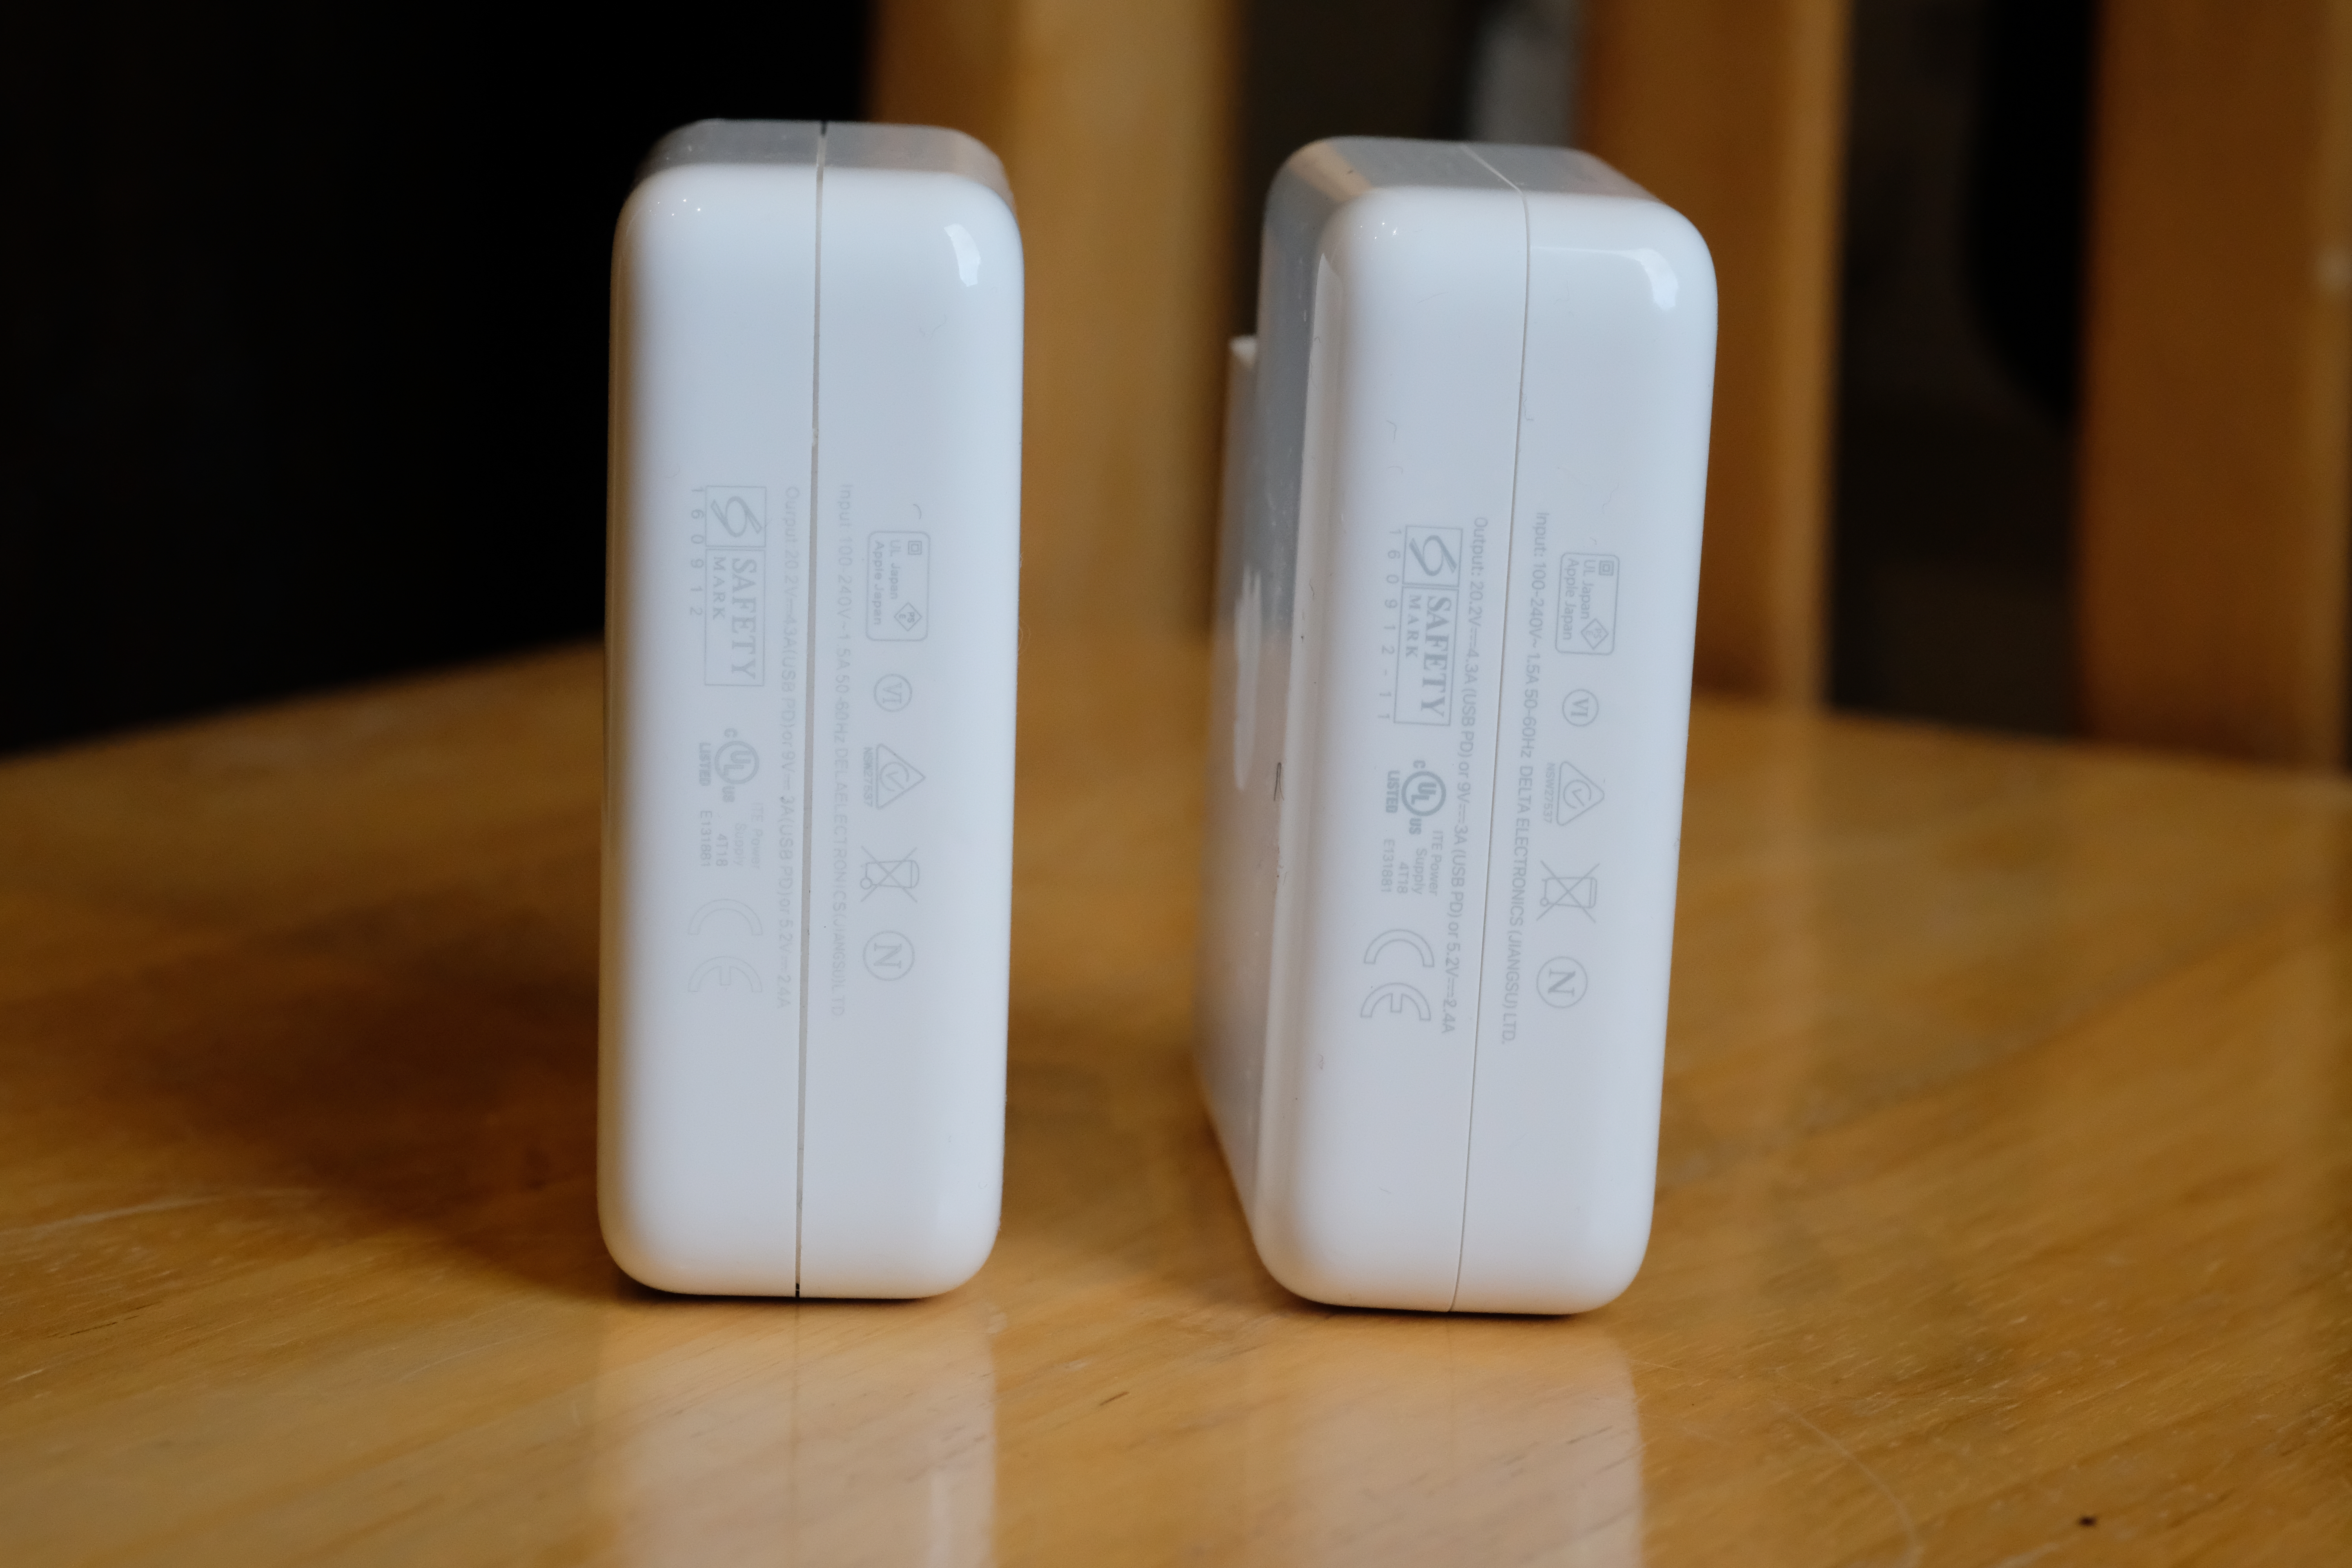
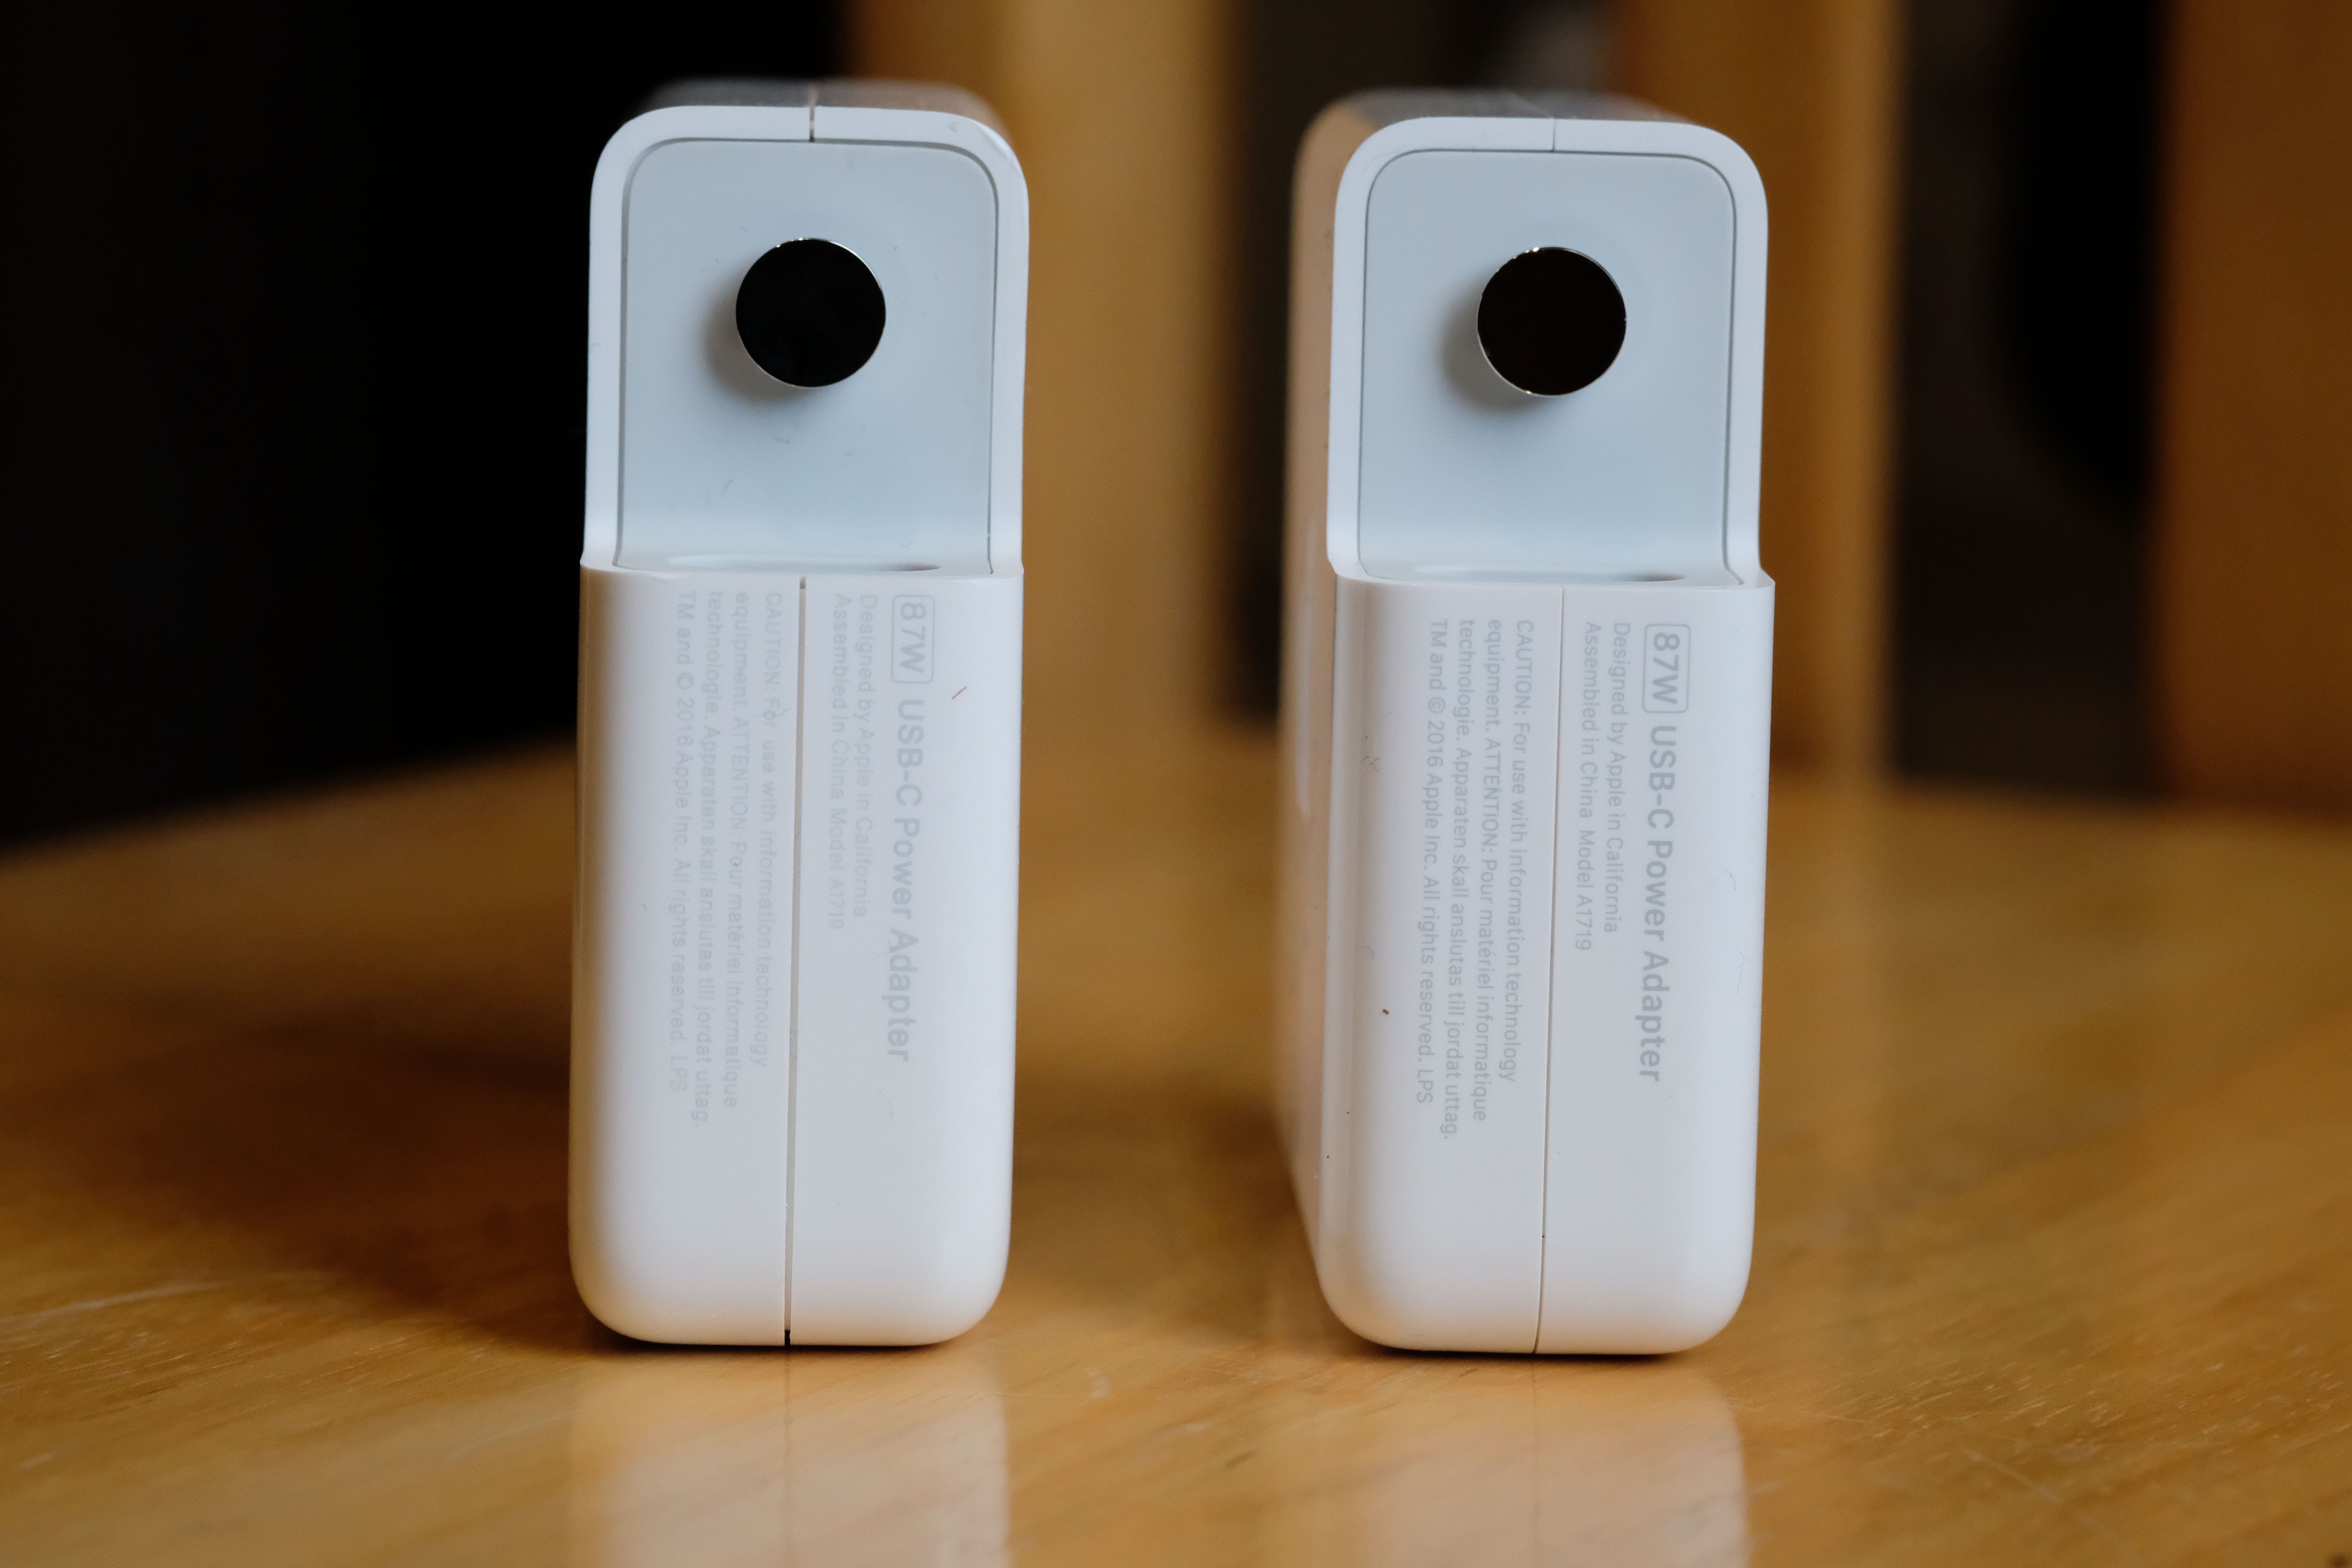
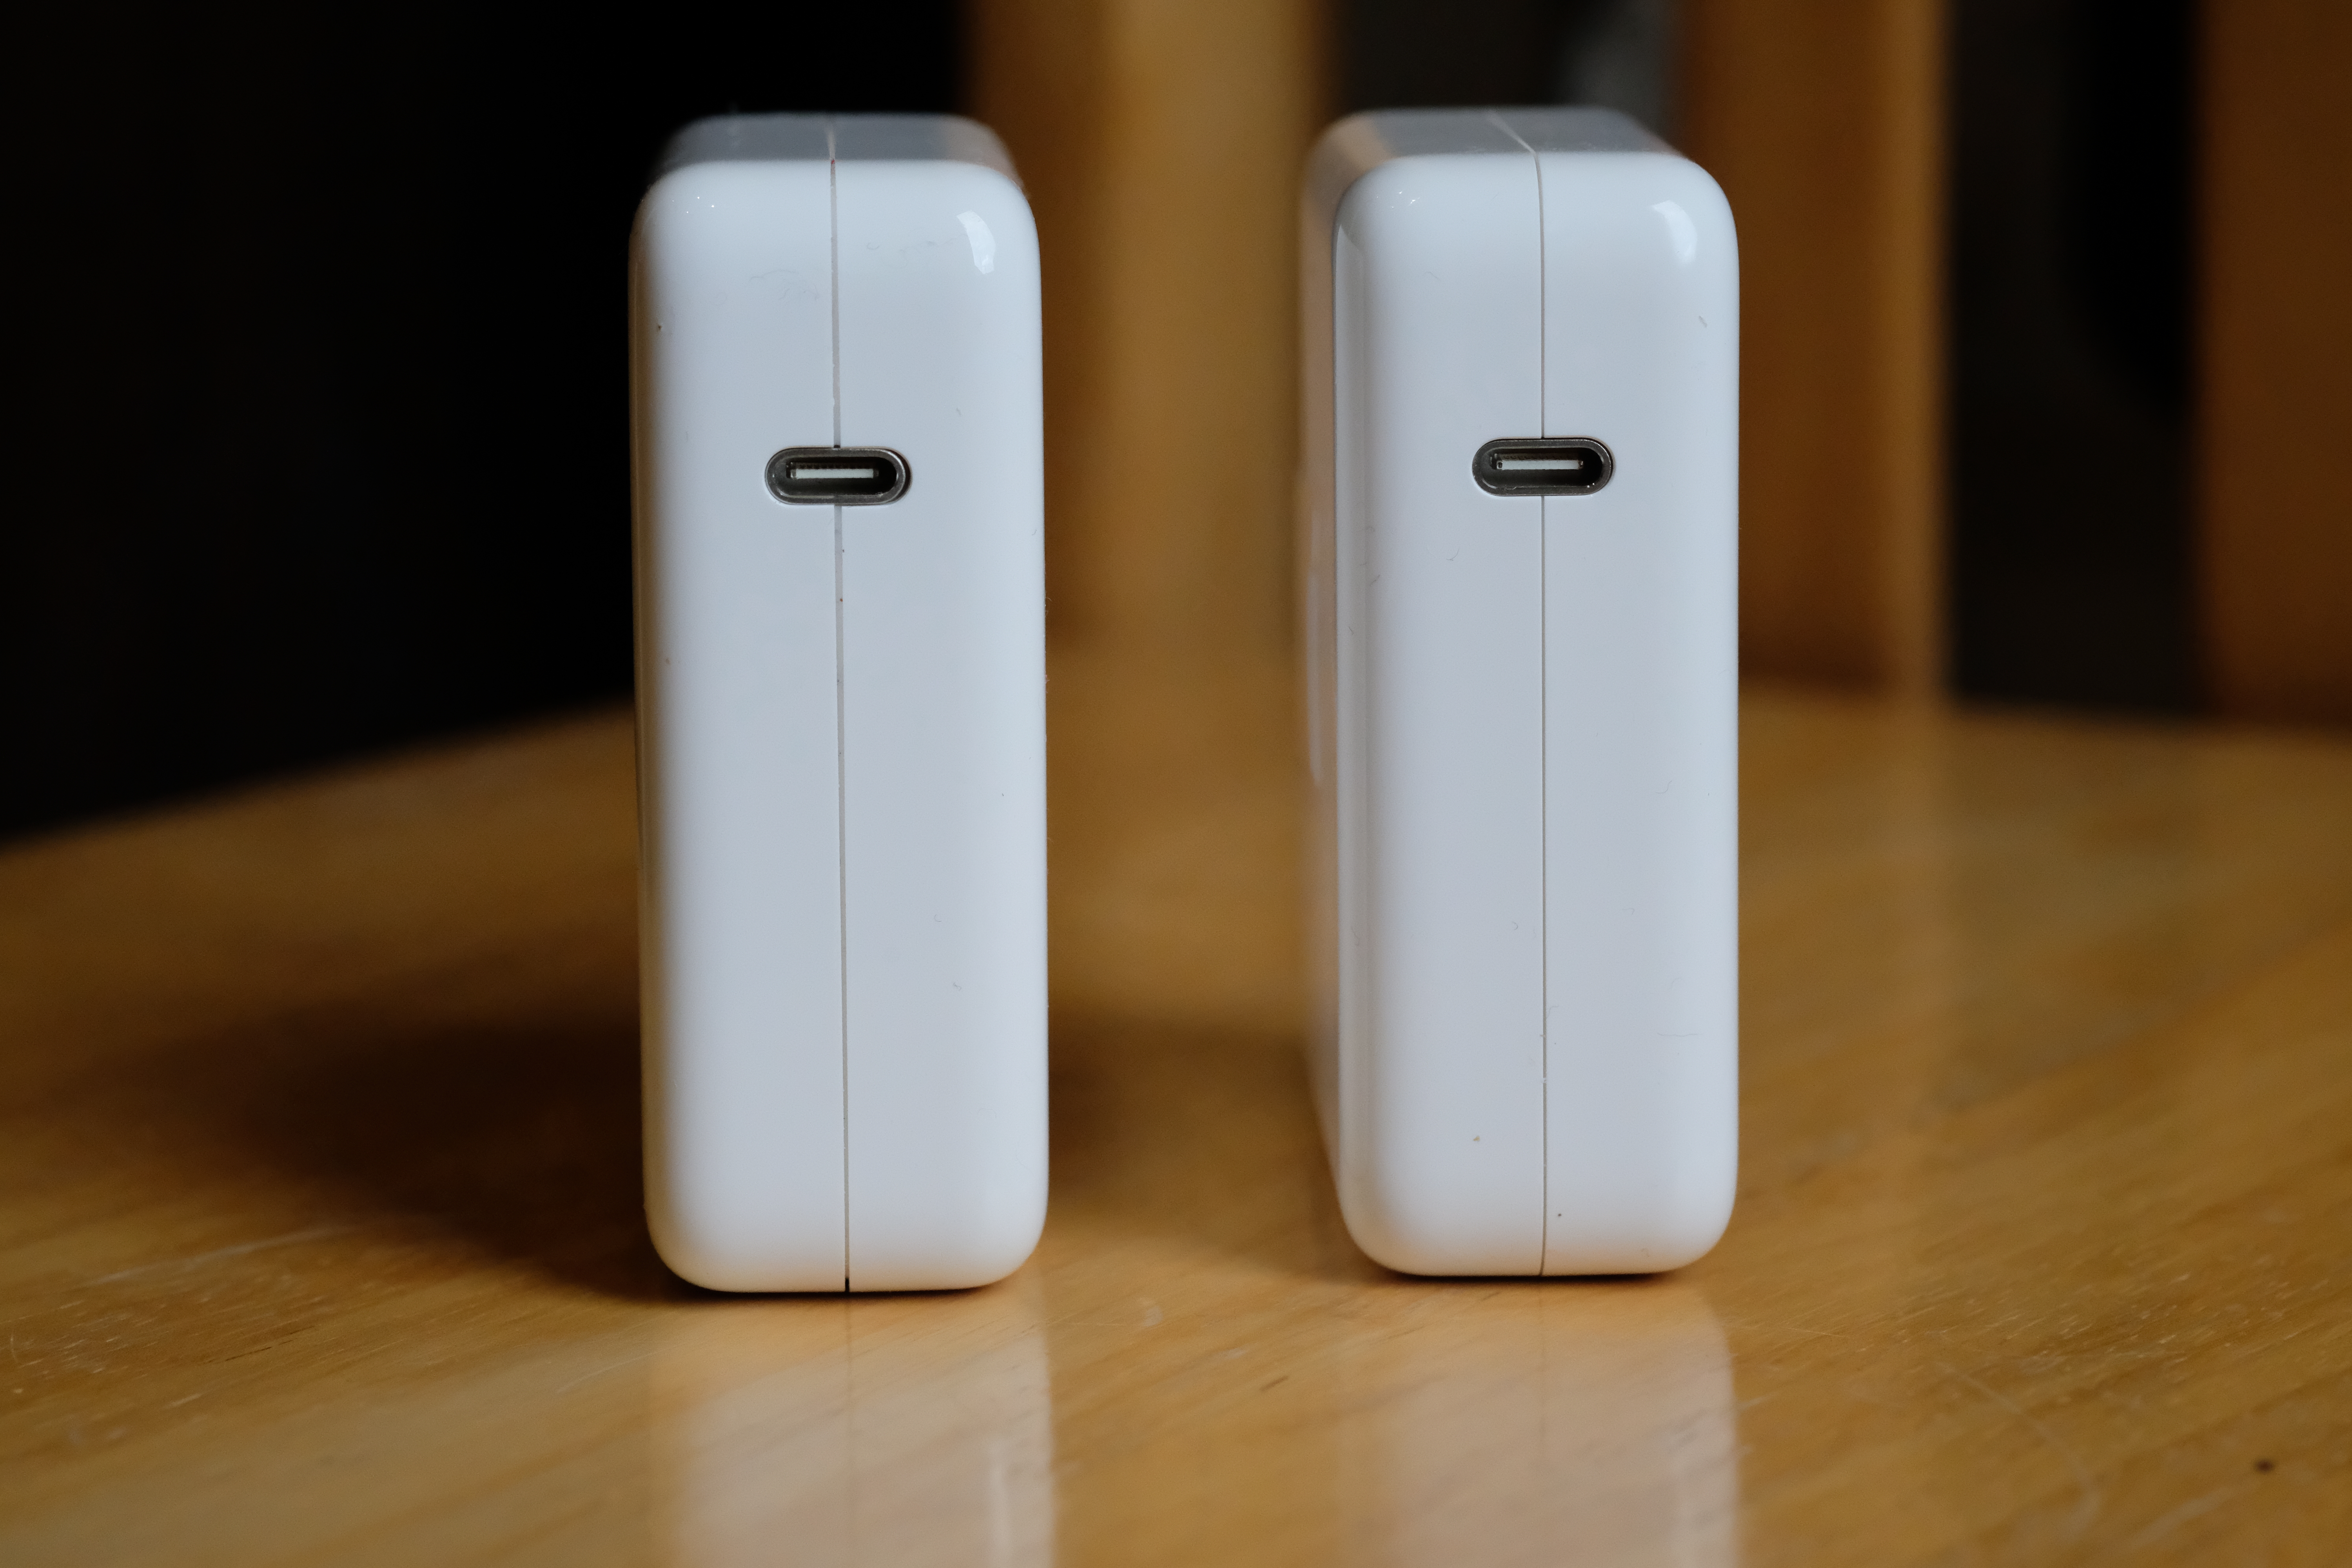
In short, the screen printing is clearer, and the seams are tighter. In the last photo above, notice that the fit of the USB-C cut-away is pretty sloppy.

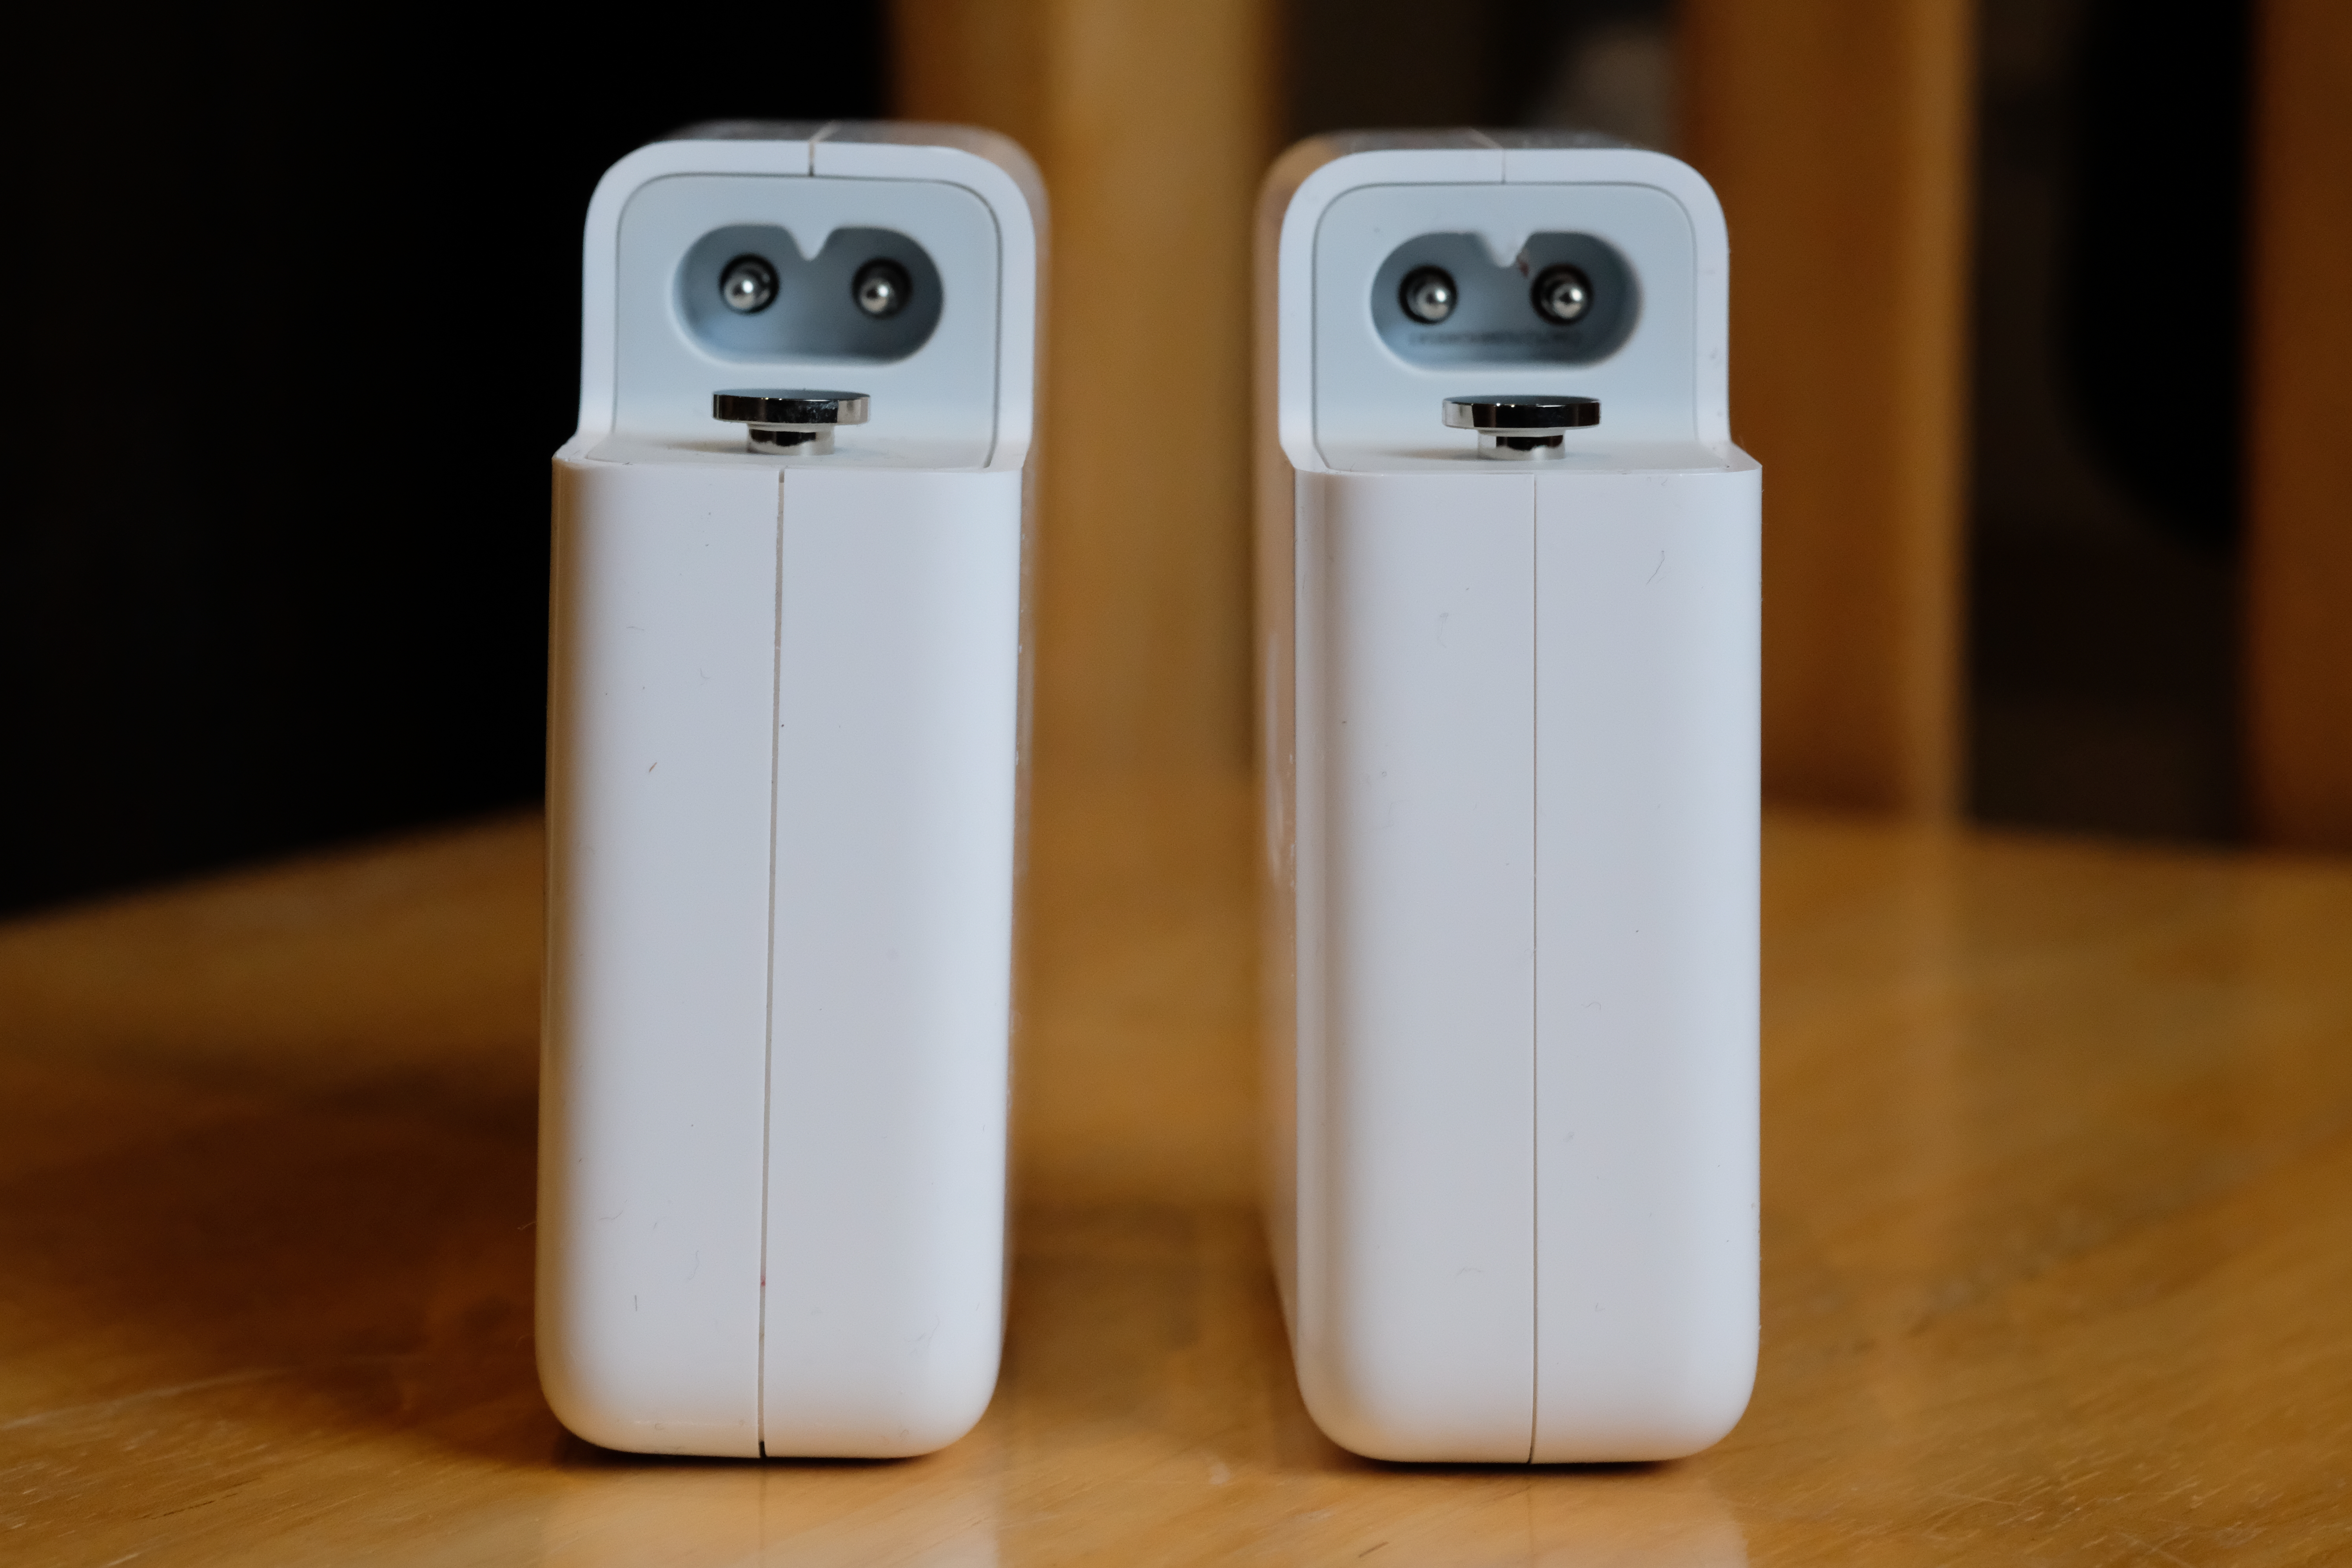
But there’s also one other major difference. The “bundled” PSU’s serial number is printed deep inside the power connector…

This seems  to be a new move by Apple, as previous PSUs had the serial number on a sticky label next to the retaining pin. So at best, I think my “other” PSU is an early edition. But then, it’s strange that it has no serial number at all.

The “other” PSU is also about 4 grams lighter than the “bundled” one. What only 4 grams? Yes, but without opening it up, it’s difficult to know, though fakers have been known to add ballast.

However, I do think there is another way to tell them apart. Ladies and gentlemen, I give you “The Knock-off Knock-off”…

I tried this test a number of times, switching the PSUs around in my hand. To my ears, at least, the “other” PSU (the second one) sounds a little more hollow than the “bundled” one.

When I first spoke on the phone (before visiting the shop), when three of us visited the shop, and in email correspondence since, the independent retailer has insisted that his products are “genuine”…

We only sell genuine parts, these are not retail boxed hence why the serial number does not match within an Apple store, as when you purchase retail boxed products, the large extra fee you pay is to allow you to be on their system and be able to take a faulty product back to any Apple store, anywhere in the world. If you are not happy with your purchase then by all means please bring back to us and we will refund you no problem.

I have since bought another PSU and cable in “retail boxes” from our local Apple Premium Reseller. Unlike the “other” products purchased from the independent retailer, the “retail boxed” and “bundled” products are identical in every detail (except for their serial numbers, of course).

One consolation is that the Apple charger is able to charge and/or power just about any other USB-C device (as well as iPhones and iPads via a UCB-C to Lightning cable). I’m convinced that being all-USB-C is a really good thing.

But I’m not sure what to do next. I’m NOT going to name and shame my source in public. I have to assume that he was acting in good faith. Perhaps I should just return the goods for the promised refund? However, I’d hate to think that someone else might end pulling 87 Watts through a substandard cable.

Suggestions?

Google Maps app for iOS thinks we drive on the right in the UK

On July 17th I upgraded my iPhone 4S and iPad 2 to Google Maps 2.0.14.10192. Apart from various bug fixes and UI improvements, the big thing for me was proper full resolution support for iPad.

Over the past few days I have used the traffic info in Google Maps to assess congestion on motorways such as the M6, M25 and M42 … and in each case, I have found myself in the middle of traffic that the iOS app displays a being on the other carriageway.

Today I was travelling West (aka South) on the M42. The Google Maps app clearly shows the traffic on the East (aka North) carriageway …

IMG_0171

Here’s what the much-maligned native iOS Maps app displays …

IMG_0172

It would appear that this latest version of Google Maps for iOS thinks that we drive on the right in the UK!

Beyond iostat 1 second samples with DTrace

I am a big fan of “iostat -x” for a first look at how a Solaris/Illumos system’s storage is doing. A lot of third party performance tools (e.g. Zabbix, BMC, SCOM, etc) also use iostat or the same underlying kstats. However, when a system has more than just a few disks/LUNs the stats become hard to read and costly to store, so the temptation is to sample them less frequently. Indeed, it is not unusual for iostats to be sampled at 15 seconds or greater.

Here’s an example of “iostat -x 15” output:

device    r/s    w/s   kr/s   kw/s wait actv  svc_t  %w  %b
sd40      0.0    1.5    0.0   29.1  0.0  0.0    0.2   0   0
sd41     12.3    0.0 1735.2    0.0  0.0  0.1    7.0   0   9  
sd42     12.2    0.0 1539.1    0.0  0.0  0.1    7.2   0   9  
sd43      4.0   13.6  658.6 2004.9  0.0  0.1    2.9   0   5  
sd44      3.5   14.7  640.9 2126.1  0.0  0.1    3.1   0   6  
sd45      3.3   11.8  599.4 2097.4  0.0  0.1    3.6   0   5  
sd46      3.3   11.1  547.2 2248.4  0.0  0.1    3.8   0   5  
sd47      3.9   11.3  684.9 2248.4  0.0  0.1    4.0   0   6  
sd48      3.3   11.3  582.3 2097.4  0.0  0.1    3.8   0   6  
sd49      5.2    9.2  719.8 2119.8  0.0  0.1    3.7   0   5  
sd50      2.9    9.5  462.9 2119.8  0.0  0.0    3.7   0   5  

There’s plenty of useful information in there. However, the provided kstats do not differentiate between read and write latency. This means, for example, that many writes to a LUN which has a write cache could mask poor read latencies. So, for some time I have been using DTrace to provide IO statistics that look more like this …

    time         r/s     Kr/s     us/r         w/s     Kw/s     us/w
     115          66     7659     4354         257    33077     3535
     130          54     4753     5057         313    41208     4225
     145          81    10056     3986         263    30093     1028
     160          99    12923     4881         302    33146     5404
     175          44     4807     4161         318    41669     1638
     190          31     4017     3390         267    32117     1591
     205          40     4237     3782         267    31671     1186
     220         385    44153     7386         300    37612     9552
     235         325    38326     6620         252    29397     1217
     250          99    13185     6507         415    49924     9394

Here the basic statistics (IOPS, bandwidth and latency), differentiated by direction, are aggregated across a set of LUNs with the addition of a handy timestamp (in seconds). However, with a 15 second interval things are still pretty boring, so here’s how the “160” data looks with 1 second samples …

    time         r/s     Kr/s     us/r         w/s     Kw/s     us/w
     146           7      896     2449         186     3458     5980
     147          13     1416     3815          96      756    48367
     148         127    16319     3666           1        0       13
     149          42     5254     3738           0        0        0
     150           1      128      509           1        0       28
     151          15     1676     2522           4       16       30
     152          22     2816     3645          49      432     6385
     153          48     5920     6314           0        0        0
     154          23     2832    17770        3918   488337    18345
     155         306    37275     6016         138     2404      180
     156         473    62128     9277           0        0        0
     157           7      896      540         143     1631     1678
     158          24     2838     3176           0        0        0
     159          39     4637     4265           0        0        0
     160         347    48820     5523           4      165       67

Some will recognise the signature “breathing” associated with ZFS transaction group writes (i.e. when data from non-synchronous writes is periodically flushed to disk).

The system under test serves files via NFS over a 10Gbps Ethernet, and clients complain of occasional 100-500ms spikes in read latency. However, although the above 1 second samples show a small increase in mean read latency, it doesn’t look like much to worry about.

The system is connected to a few dozen fast drives via a 4x 6Gbps SAS link. The maximum theoretical bandwidth is, therefore, 24Gbps (i.e 3GBps). Again, the 1 second sample showing nearly 500MBps doesn’t seem that significant.

But now let’s go where iostat cannot, zooming in on the “154-144” interval with 10Hz sampling …

    time         r/s     Kr/s     us/r         w/s     Kw/s     us/w
   153.1          10     1280     3875           0        0        0
   153.2           0        0        0           0        0        0
   153.3          10     1280     5506           0        0        0
   153.4           0        0        0           0        0        0
   153.5           0        0        0           0        0        0
   153.6         100    12800     4829        7550   331625     3194
   153.7          10     1280     4082       13240  1993760    22143
   153.8          20     2560   136888        4150  2171420    82941
   153.9          40     5120    13776        1350   286795    73533
   154.0          40     4000     8753       12890    99770     1640
   154.1          80    10240     6460        1140    23800      879
   154.2          30     1450     6748         240      240      923
   154.3          20     2560     7926           0        0        0
   154.4         200    25600    11560           0        0        0
   154.5           0        0        0           0        0        0
   154.6        1420   179665     9317           0        0        0
   154.7        1300   151960     8097           0        0        0
   154.8           0        0        0           0        0        0
   154.9           0        0        0           0        0        0
   155.0          10     1280    10052           0        0        0

And there it is! In just 200ms we see 400MB written (i.e. at over 2GBps), at which point mean read latency peaks at 137ms. So ZFS’s transaction group writes appear to be starving reads, causing latency spikes invisible with 1 second sampling. We will investigate this further in a subsequent blog post.

Yes, there are many ways to have reach this point with DTrace, however this scenario does serve to demonstrate one of them. Perhaps the main point is that 1 second sampling hides far too much from view (and calls into question the usefulness of the much larger intervals favoured by so many).

Snow Leopard users, beware T-Mobile USB sticks!

I was attracted by T-Mobile’s new £15/month offer (first three months £10) with the new Mobile Broadband USB Stick 620 (capable of HSDPA 7.2). The box clearly states “Mac OS X v10.4.x or above”. However, when I installed the supplied software on my nice new Macbook Pro (which came with Snow Leopard, that is v10.6, installed) my system was rendered unusable on the next reboot. I am extremely grateful to David Glover for his workaround.

To get my machine back I had to …

1) boot in firewire target mode (hold down T while powering up)
2) attach to another Mac using a firewire cable
3) download the libcurl.4.dylib archive from David Glover’s post
4) install the above file in usr/lib/libcurl.4.dylib on the target machine
5) unmount the target machine
6) boot the target machine normally (it works)

But to get the T-Mobile broadband to work again I had to …

1) save a copy of the “good” libcurl.4.dylib
2) run /Applications/T-Mobile Mobile Broadband Manager/Uninstall_T-Mobile Mobile Broadband Manager.app
3) insert the USB stick
4) run the installer from there (I had previously used the CDROM that came with the stick)
5) copy the “good” libcurl.4.dylib back into /usr/lib
6) restart T-Mobile Mobile Broadband Manager

I have a call outstanding with T-Mobile (who were unaware of the problem), and will post an update as and when the fix the problem. It is astonishing that third party software should overwrite vital system files! As of now I don’t know what else they’ve broken, although I was alarmed to find other files in /usr/lib with the same timestamp …

$ ls -l /usr/lib/ | grep Feb
-rwxr-xr-x    1 pgdh  staff    163616 27 Feb  2009 bkLib.dylib
-rwxr-xr-x    1 pgdh  staff    179412 27 Feb  2009 libAgent.dylib
-rwxr-xr-x    1 pgdh  staff    208640 27 Feb  2009 libTinyXml.dylib
-rwxr-xr-x    1 pgdh  staff    522284 27 Feb  2009 libcurl.4.dylib.broken
-rwxr-xr-x    1 pgdh  staff     25464 27 Feb  2009 libmd5.dylib
$

More news as it happens.

“You know something about computers…”

I hear those dread words too often from friends and family. Despite my personal crusade to convert the world to UNIX — “Friends don’t let their friends run Winduhs” (TM) — the call is invariably a plea to rescue some dire Redmond-infected platform from oblivion.

And so it was that the door bell rang a couple of days ago. On the door step stoop a neighbour clutching an over-sized (if you sat in the middle of the keyboard, you probably could get the advertised 5.1 surround sound), top-of-the-range, Blu-ray-equiped, totally-plastic, ACER aircraft carrier. In fact, it was the very same laptop I helped setup a few months ago. And what a good thing it was that I’d taken the time to burn the three recovery DVDs, because some rascal had set a password on the internal SATA boot drive!

Once a password is set on a SATA drive, you’re hosed if you don’t know it. I phoned up ACER, who were very nice and picked up the call immediately. However, they such situations are outside of warranty, and that it would cost £50 plus the cost of a new drive to fix the machine. Googling around, I discovered HDD Unlock, which claims to be freeware. I moved the drive into a USB/SATA enclosure, but quickly discovered that HDD Unlock only works on directly attached IDE and SATA drives.

Dusting off a old XP machine that hadn’t been booted in years, I attached the drive and “Hey presto!” HDD Unlock said it could unlock the drive … for a fee. Normally, I take exception to those that take advantage of others in dire straits, but it seemed like a good deal: £16 to unlock a 320GB drive (the bigger the drive, the more you pay). Being a top-of-the-range computer, it had a pretty decent hard drive (WD3200BJKT), which would have cost around £60 to replace.

One PayPal transaction and 90 minutes later (the bigger the drive, the longer it takes), the drive was unlocked, and I was able to reinstall it in the ACER monster and complete a full factory fresh install from the media I’d previoiusly created. I only record this here, because you may know of someone in a similar situation, or you may be in such a situation, and if you’re in a situation like that …

Low latency computing with Solaris and DTrace

Over the past couple of years I’ve helped a number of financial institutions identify and eliminate or significantly reduce sources of latency and jitter in their systems. In the city there’s currently something akin to an arms race, as banks seek to gain a competitive edge by shaving microseconds off transaction times. It’s all about beating the competition to make the right trade at the right price. A saving of one millisecond can be worth millions in profit. And the regulatory bodies need to be able to keep up with this new low latency world too.

Code path length is only part of the picture (although an important one). However, processor architectures with challenging single thread performance (such as Sun’s T-series systems) are still able to offer competitive advantage in scenarios where quick access to CPU resource is a bigger factor. Your mileage will vary.

When it comes to jitter I’ve seen a fair amount of naivety. Just because I have 32 cores in a system doesn’t mean I won’t see issues such as preemption, interrupt pinning, thundering herds and thread migration. Thankfully, DTrace provides the kind of observability I need to identify and quantify such issues, and Solaris often has the features needed to ameliorate them, often without the need to change application code.

I generally find that there is a lot of “low hanging fruit”, and am often able to demonstrate a dramatic reduction in jitter and absolute latency in a short amount of time. You may have seen some pretty big claims for DTrace, but in my experience it is hard to over-hype what can be achieved. It’s not just about shaving milliseconds of transaction times, but about reducing the amount of hardware that needs to be thrown at the problem.

DTrace for dummies – Complexity

DTrace is many things to many people. To me it is a tool for engaging with complexity. Sure there’s an important place for the DTrace Toolkit, advanced OpenStorage analytics, Chime and other wonderful technologies built on DTrace (most of which don’t even come close to exposing the user to the more low-level cranium challenging detail), but for me DTrace remains “The One True Tool” (as slashdot reviewer) and the means by which I can ask an arbitrary question and get an instant answer.

When presenting DTrace to a new audience, I see my primary goal as creating desire. Nothing worth having comes easily. Getting to grips with DTrace involves a steep learning curve. Before exposing candidates to potentially overwhelming detail, I need to show them why the gain is going to be worth the pain. It’s also useful to underline some seeds of self doubt and insecurity, to establish my authority as the teacher they can trust. So I generally start by talking about complexity.

All I’m going to blog here is one of my favourite complexity stories. It is best done live, with lots of stuff scrolling up a green screen, and plenty of theatrical flare. However, for the purpose of this post I’ve done the UNIX thing and used a pipe into the wc(1) command. I’m sorry if it loses something in the telling, but the base data is still interesting.

I usually start by talking about how complexity has increased during my time at Sun. In the good old days when we all programmed in C it was possible for one person to have a handle on the whole system. But today’s world is very different. In a bid to connect with the old timers, we start talking about “Hello World!”. I then show how good the truss(1) utility is at exposing some of the implementation detail.

We then move on to a Java implementation. The code looks similar, and it is functionally equivalent. Although both the C and Java versions complete in far less then a second, even the casual observer can see that the Java variant is slower. I then start digging deeper with truss(1). First, we compare just the number of system calls, then the number of inter-library function calls, the lastly, the number of intra-library function calls.

This post is really just the raw data, simply to underline the point that todays software environments are a lot more complex than we often give them credit for; and secondly, that we need a new generation of tools to engage with this level of complexity. For added fun, I’ve added Perl and Python data to the mix. Enjoy!

The Code

opensolaris$ head -10 hello.c hello.pl hello.py hello.java
==> hello.c <==
#include 
int
main(int argc, char *argv[])
{
    (void) printf("Hello World!n");
}
==> hello.pl <==
#!/usr/bin/perl
print "Hello World!n";
==> hello.py <==
#!/usr/bin/python
print "Hello World!"
==> hello.java <==
public class hello {
    public static void main(String args[]) {
        System.out.println("Hello World!");
    }
}

It works!

opensolaris$ ./hello
Hello World!
opensolaris$ ./hello.pl
Hello World!
opensolaris$ ./hello.py
Hello World!
opensolaris$ java hello
Hello World!

Sycalls

opensolaris$ truss ./hello 2>&1 | wc -l
33
opensolaris$ truss ./hello.pl 2>&1 | wc -l
118
opensolaris$ truss ./hello.py 2>&1 | wc -l
660
opensolaris$ truss java hello 2>&1 | wc -l
2209

Inter-library calls

opensolaris$ truss -t!all -u : ./hello 2>&1 | wc -l
9
opensolaris$ truss -t!all -u : ./hello.pl 2>&1 | wc -l
232
opensolaris$ truss -t!all -u : ./hello.py 2>&1 | wc -l
31578
opensolaris$ truss -t!all -u : java hello 2>&1 | wc -l
12055

Note: these numbers need to be divided by two (see the raw output for why).

Intra-library calls

opensolaris$ truss -t!all -u :: ./hello 2>&1 | wc -l
329
opensolaris$ truss -t!all -u :: ./hello.pl 2>&1 | wc -l
10337
opensolaris$ truss -t!all -u :: ./hello.py 2>&1 | wc -l
548908
opensolaris$ truss -t!all -u :: java hello 2>&1 | wc -l
4142645

Note: these numbers also need to be divided by two (see above).

Context

opensolaris$ uname -a
SunOS opensolaris 5.11 snv_111b i86pc i386 i86pc Solaris

Conclusion

Of course the above gives no indication of how long each experiment took. Yes, I could have wrapped the experiment with ptime(1), but I'll leave that as an exercise for the reader. When I use this illustration with a live audience, it's generally sufficient to allow the longest case to continue to scroll up the screen for the rest of the presentation.

At this point, I generally move on. Usually, I say some kind words about high level languages, abstraction, code reuse etc. I am not out to knock Java. That's not the point. The point is complexity. I then move on to how DTrace can help us to engage with complexity. I'd do that here, but I hope that I'll continue to be asked to speak on the subject, and I don't want to give it all away here, just now.

Continue reading

About

My employement at Sun will end on September 30th, 2009. This was my choice (I was made an offer I simply couldn’t refuse). I am currently exploring future employment options, and am open to offers and suggestions. I see this and recent posts to my blog as a legitimate way to “set out my stall”. The remainder of this post is background copied from materials supporting my recent promotion…

Who

Hi, my name is Phil Harman and I’m a Senior Staff Engineer and Principal Field Technologist (PFT) attached to the Systems Practice in Sun UK. I joined Sun in February 1989, and have been an OS Ambassador for most of the intervening years. When
I joined the Systems Practice in November 2007, I also became a Technical Systems (TS) Ambassador.

Solaris, holistic systems performance and extreme multithreading are my long term interests and areas of expertise. After about 5 years in the UK Performance Centre, and a spell in the Products and Technologies Specialists Group (a forerunner of the Systems Practice), I spent four years in Performance and Availability Engineering (PAE), before moving on to the Solaris Kernel Performance Group.

It’s official: I’m an inventor, and I have the patent to prove it! I’m also co-architect of the OpenSolaris
project libMicro, and consequently became originator of the slogan: “If Linux is faster, it’s a Solaris bug!”.

How

I have a reputation for being a passionate evangelist for Sun technology. I joined the company because I was nuts about UNIX and impressed with SPARC (I still am both). I hate FUD and shallow “me too” marketing. I love the moral high ground, and believe our customers deserve the truth, not wishful thinking. I believe Sun can and does make a difference, and that our disruptive technologies delivers real business value (in 20 years I have been involved in many such examples).

My holistic approach to systems performance means that I am also a “people person”. I detest dehumanising business practices. “I am not a number”, so if you [just] “want information”, “you won’t get it!”. I like to get up close and personal with my customers, to see the whites in their eyes, because like House MD, I know that “people lie”.

Where

I live and work in North Wales, in the UK. Over the past few years I seem to have spent more time in Menlo Park, California offices than in my designated office in Sale, Cheshire. When I’m not working from home, I am often on site with customers (generally in London … it’s only a 2.5 hour journey, and I can work on the train).

If you need to contact me Namefinder is your friend (if you’re a Sun employee, but only until the end of this month). Email is generally best, but in emergencies I’m usually near my mobile phone. My private email address is phil.harman@gmail.com.

What

I talk a lot. If you need a Sun technology pitch, then I’m your man! I’m most at home with Solaris, SPARC, CMT, holistic systems performance and multithreading, but I take an active interest in other areas of Sun innovation. However, I prefer to speak about what I know in depth because I think people want to hear from speakers with authority, integrity and passion. I don’t take myself too seriously, but I will only use my own slide deck, thankyou!

I take on a lot of performance work. This could be a proof of concept, or perhaps rolling up my sleeves to deal with some melt-down escalation or other. I am very data driven, and have many tricks up my sleeve for obtaining it by hook or by crook. In my various roles in the field and in engineering, on job rotations and through the ambassador programme, as an international conference speaker and with many customers internaqtionally, I have built a broad network of useful contacts among whom I often function a rabble rouser or dating agency.

Until recently I was spending a lot of time (generally oncee per week, for the last couple of years) explaining the CMT value proposition to customers who didn’t quite get it, sometimes with major repercussions. Within the last year I have spent quite a lot of time (sic) reducing latency and jitter in realtime trading systems, and inincreasing throughput on large backend systems.

As part of the UK Systems Practice, my primary focus was on leveraging systems sales. As such I tended not to take on chargeable work (the ROI didn’t add up, and I’d rather be out selling Sun technology elsewhere). However, I did see myself as an SMI citizen first and foremost (I grew up during the golden days of Sun’s “can do” ethos, in McNeally’s “to ask permission is to seek denial” culture).