Niagara 2 memory throughput according to libMicro

libMicro is a portable, scalable microbenchmarking framework which Bart Smaalders and I put together a little while back. It is available to the world via the OpenSolaris website, under the CDDL license, so there really is nothing to stop you recreating the data in this posting.

Although designed for testing individual APIs, the libMicro framework has proven useful for other investigations. For instance, the memrand case, which does negative stride pointer chasing, can be configured to test processor and cache and memory latencies…

huron$ bin/memrand -s 128m -B 1000000 -C 10
prc thr   usecs/call      samples   errors cnt/samp     size
memrand       1   1      0.15232           12        0  1000000 134217728
huron$

The above shows 12 samples (we asked for at least 10) of 1,000,000 negative stride pointer references striped across 128MB of memory. The platform is a Sun SPARC Enterprise T5220 server, with a UltraSPARC T2 processor running at 1.4GHz. This simple test indicates a memory read latency of 152ns.

But we can also use libMicro’s multiprocess and multithread scaling capabilities to extend this test to measure memory throughput scaling…

huron$ for i in 1 2 4 8 16 32 64; do bin/memrand -s 128m -B 1000000 -C 10 -T $i; done
prc thr   usecs/call      samples   errors cnt/samp     size
memrand       1   1      0.15223           12        0  1000000 134217728
prc thr   usecs/call      samples   errors cnt/samp     size
memrand       1   2      0.15176           12        0  1000000 134217728
prc thr   usecs/call      samples   errors cnt/samp     size
memrand       1   4      0.15208           12        0  1000000 134217728
prc thr   usecs/call      samples   errors cnt/samp     size
memrand       1   8      0.25472           12        0  1000000 134217728
prc thr   usecs/call      samples   errors cnt/samp     size
memrand       1  16      0.26242           12        0  1000000 134217728
prc thr   usecs/call      samples   errors cnt/samp     size
memran        1  32      0.24964           12        0  1000000 134217728
prc thr   usecs/call      samples   errors cnt/samp     size
memrand       1  64      0.24063           12        0  1000000 134217728
huron$

This shows that up to 4 concurrent threads see 152ns latency, with 64 threads (i.e. full processor utilisation) seeing 240ns latency, which equates to a throughput of 267 million memory reads per second (i.e. 64 / 0.240e-6). Just to set this in context, here are some data for a quad socket Tigerton system running at 2.93GHz…

tiger$ for i in 1 2 4 8 16; do bin/memrand -s 128m -B 1000000 -C 10 -T $i; done
prc thr   usecs/call      samples   errors cnt/samp     size
memrand       1   1      0.15559           12        0  1000000 134217728
prc thr   usecs/call      samples   errors cnt/samp     size
memrand       1   2      0.15621           12        0  1000000 134217728
prc thr   usecs/call      samples   errors cnt/samp     size
memrand       1   4      0.15667           12        0  1000000 134217728
prc thr   usecs/call      samples   errors cnt/samp     size
memrand       1   8      0.17726           12        0  1000000 134217728
prc thr   usecs/call      samples   errors cnt/samp     size
memrand       1  16      0.18654           12        0  1000000 134217728
tiger$

This shows a peak throughput of about 86 million memory reads per second (i.e. 16 / 0.186e-6), making the single chip UltraSPARC T2 processor’s throughput 3x that of its quad chip rival. Of course, mileage will vary greatly from workload to workload, but pretty impressive nonetheless, heh?

Now what’s the chance of that?

“Congratulations, you have been randomly selected to win a free all accommodation included vacation to Florida Bahamas. Press 9 for more information.”

How lucky am I?!

I received this automated call twice within ten minutes to two different phone numbers! How random is that?!”

So what possessed me to hang up? Well, if you have any sense, you’ll do the same. If these people can’t even be honest about the way choose your number, why should you trust them with anything else?

Moral: If something appears too good to be true, it probably is.

Anyway, must dash as I’ve got to book my tickets for Nigeria. A very friendly lady who is the widow of some ex quasi government official needs my help laundering a few million dollars…

Taking UFS new places safely with ZFS zvols


I’ve just read a couple of intriguing posts which discuss the possibility of hosting UFS filesystems on ZFS zvols. I mean, who in their right mind…? The story goes something like this …

# zfs create tank/ufs
# newfs /dev/zvol/rdsk/tank/ufs
# mount /dev/zvol/dsk/tank/ufs /ufs
# touch /ufs/file
# zfs snapshot tank/ufs@snap
# zfs clone tank/ufs@snap tank/ufs_clone
# mount /dev/zvol/dsk/tank/ufs_clone /ufs_clone
# ls -l /ufs_clone/file

Whoopy doo. It just works. How cool is that? I can have the best of both worlds (e.g. UFS quotas with ZFS datapath protection and snapshots). I can have my cake and eat it!

Well, not quite. Consider this variation on the theme:

# zfs create tank/ufs
# newfs /dev/zvol/rdsk/tank/ufs
# mount /dev/zvol/dsk/tank/ufs /ufs
# date >/ufs/file
# zfs snapshot tank/ufs@snap
# zfs clone tank/ufs@snap tank/ufs_clone
# mount /dev/zvol/dsk/tank/ufs_clone /ufs_clone
# cat /ufs_clone/file

What will the output of the cat(1) command be?

Well, every time I’ve tried it so far, the file exists, but it contains nothing.

The reason for this is that whilst the UFS metadata gets updated immediately (ensuring that the file is created), the file’s data has to wait a while in the Solaris page cache until the fsflush daemon initiates a write back to the storage device (a zvol in this case).

By default, fsflush will attempt to cover the entire page cache within 30 seconds. However, if the system is busy, or has lots of RAM — or both — it can take much longer for the file’s data to hit the storage device.

Applications that care about data integrity across power outages and crashes don’t rely on fsflush to do their dirty (page) work for them. Instead, they tend to use raw I/O interfaces, or fcntl(2) flags such as O_SYNC and O_DSYNC, or APIs such as fsync(3C), fdatasync(3RT) and msync(3C).

On systems with large amounts of RAM, the fsflush daemon can consume inordinate amounts of CPU. It is not uncommon to see a whole CPU pegged just scanning the page cache for dirty pages. In configurations where applications take care of their own write flushing, it is considered good practice to throttle fsflush with the /etc/system parameters autoup and tune_t_fsflushr. Many systems are configured for fsflush to take at least 5 minutes to scan the whole of the page cache.

From this is it clear that we need to take a little more care before taking a snapshot of a UFS filesystem hosted on a ZFS zvol. Fortunately, Solaris has just want we need:

# zfs create tank/ufs
# newfs /dev/zvol/rdsk/tank/ufs
# mount /dev/zvol/dsk/tank/ufs /ufs
# date >/ufs/file
# lockfs -wf
# zfs snapshot tank/ufs@snap
# lockfs -u
# zfs clone tank/ufs@snap tank/ufs_clone
# mount /dev/zvol/dsk/tank/ufs_clone /ufs_clone
# cat /ufs_clone/file

Notice the addition of just two lockfs(1M) commands. The first blocks any writers to the filesystem and causes all dirty pages associated with the filesystem to be flushed to the storage device. The second releases any blocked writers once the snapshot has been cleanly taken.

Of course, this will be nothing like as quick as the initial example, but at least it will guarantee that you get all the data you are expecting. It’s not just no data we should be concerned about, but also stale data (which is much harder to detect).

I suppose this may be a useful workaround for folk waiting for some darling features to appear in ZFS. However, don’t forget that “there’s no such thing as a free lunch”! For instance, hosting UFS on ZFS zvols will result in the double caching of filesystem pages in RAM. Of course, as a SUNW^H^H^H^HJAVA stock holder, I’d like to encourage you to do just that!

Solaris is a wonderfully well-stocked tool box full of the great technology that is ideal for solving many real world problems. One of the joys of UNIX is that there is usually more than one way to tackle a problem. But hey, be careful out there! Make sure you do a good job, and please don’t blame the tools when you screw up. A good rope is very useful. Just don’t hang yourself!

Technorati Tags: , ,

Prstat + DTrace + Zones + ZFS + E25K = A Killer Combination


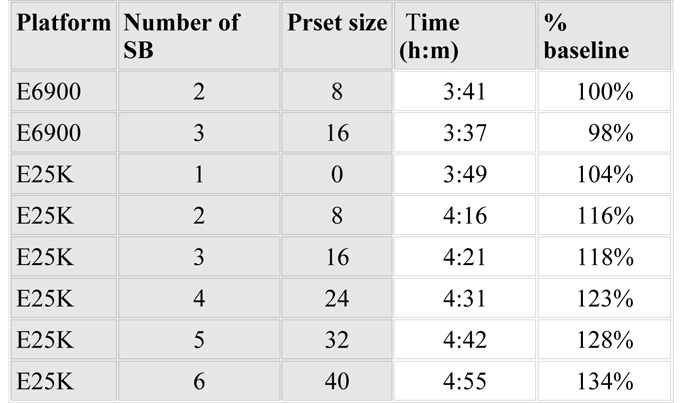
The table on the right was directly lifted from a report exploring the scalability of a fairly traditional client-server application on the Sun Fire E6900 and E25K platforms.

The system boards in both machines are identical, only the interconnects differ. Each system board has four CPU sockets, with a dual-core CPU in each, yielding a total of eight virtual processors per board.

The application client is written in COBOL and talks to a multithreaded C-ISAM database on the same host via TCP/IP loopback sockets.
The workload was a real world overnight batch of many “read-only” jobs run 32 at a time.

The primary metric for the benchmark was the total elapsed time. A processor set was used to contain the database engine, with no more than eight virtual processors remaining for the application processes.

The report concludes that the E25K’s negative scaling is due to NUMA considerations. I felt this had more to do with perceived “previous convictions” than fact. It bothered me that the E6900 performance had not been called into question at all or explored further.

The situation is made a little clearer by plotting the table as a graph, where the Y axis is a throughput metric rather than the total elapsed time.


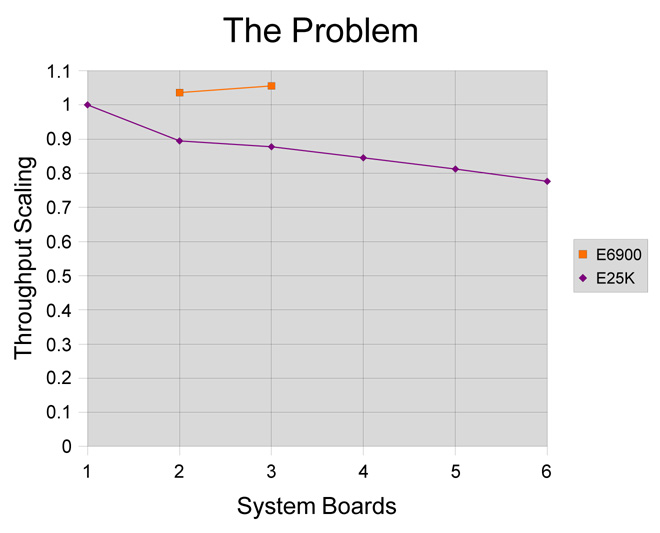
Although the E25K plot does indeed appear to show negative scalability (which must surely be somehow related to data locality), it is the E6900 plot which reveals the real problem.

The most important question is not “Why does the E25K throughput drop as virtual processors are added?” but rather “Why does the E6900 hardly go any faster as virtual processors are added?”

Of course there could be many reasons for this (e.g. “because there are not enough virtual processors available to run the COBOL client”).

However, further investigation with the prstat utility revealed severe thread scalability bottlenecks in the multithreaded database engine.

Using prstat’s -m and -L flags it was possible to see microstate accounting data for each thread in the database. This revealed a large number of threads in the LCK state.

Some very basic questions (simple enough to be typed on a command line) were then asked using DTrace and these showed that the “lock waits” were due to heavy contention on a few hot mutex locks within the database.


Many multithreaded applications are known to scale well on machines such as the E25K. Such applications will not have highly contended locks. Good design of data structures and clever strategies to avoid contention are essential for success.

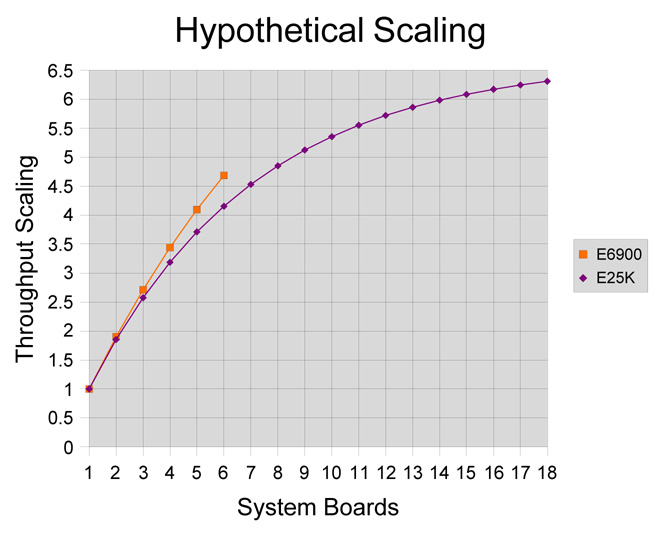
This second graph may be purely hypothetical but it does indicate how a carefully written multithreaded application’s throughput might be expected to scale on both the E6900 and the E25K (taking into account the slightly longer inter-board latencies associated with the latter).

The graph also shows that something less that perfect scalability may still be economically viable on very large machines — i.e. it may be possible to solve larger problems, even if this is achieved with less efficiently.

As an aside, this is somewhat similar to the way in which drag takes over as the dominant factor limiting the speed of a car — i.e. it may be necessary to double the engine size to increase the maximum speed by less than 50%.

Working with the database developer it was possible to use DTrace to begin “peeling the scalability onion” (an apt metaphor for an iterative process of diminishing returns — and tears — as layer after layer of contention is removed from code).

With DTrace it is a simple matter to generate call stacks for code implicated in heavily contended locks. Breaking such locks up and/or converting mutexes to rwlocks is a well understood technique for retrofitting scalability to serialised code, but it is beyond the scope of this post. Suffice it to say that some dramatic results were quickly achieved.

Using these techniques the database scalability limit was increased from 8 to 24 virtual processors in just a matter of days. Sensing that the next speed bump might take a lot more effort, some other really cool Solaris innovations were called on to go the next step.

The new improved scalable database engine was now working very nicely alongside the COBOL application on the E25K in the same processor set with up to 72 virtual processors (already somewhere the E6900 could not go).

For this benchmark the database consisted of a working set of about 120GB across some 100,000 files. With well in excess of 300GB of RAM in each system it seemed highly desirable to cache the data files entirely in RAM (something which the customer was very willing to consider).

The “read-only” benchmark workload actually resulted in something like 200MB of the 120GB dataset being updated each run. This was mostly due to writing intermediate temporary data (which is discarded at the end of the run).

Then came a flash of inspiration. Using clones of a ZFS snapshot of the data together with Zones it was possible to partition multiple instances of the application. But the really cool bit is that ZFS snapshots are almost instant and virtually free.

ZFS clones are implemented using copy-on-write relative to a snapshot. This means that most of the storage blocks on disk and filesystem cache in RAM can be shared across all instances. Although snapshots and partitioning are possible on other systems, they are not instant, and they are unable to share RAM.

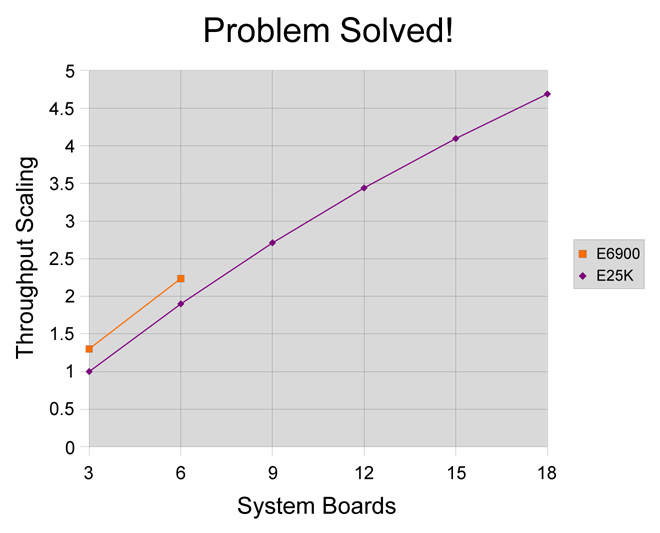
The E25K’s 144 vitual processors (on 18 system boards) were partitioned into a global zone and five local zones of 24 virtual processors (3 system boards) each. The database was quiesced and a ZFS snapshot taken. This snapshot was then cloned five times (once per local zone) and the same workload run against all six zones concurrently (in the real world the workload would also be partitioned).

The resulting throughput was nearly five times that of a single 24 virtual processor zone, and almost double the capacity of a fully configured E6900.

All of the Solaris technologies mentioned in this posting are pretty amazing in their own right. The main reason for writing is to underline how extremely powerful the combination of such innovative technologies can be when applied to real world problems. Just imagine what Solaris could do for you!

Solaris: the whole is greater than the sum of its parts.

Technorati Tags: , , , ,

A Brief History Of Solaris

A week ago I was presenting A Brief History Of Solaris at the Sun HPC Consortium in Dresden. My slideware is pretty minimalist (audiences generally don’t respond well to extended lists of bullet points), but it should give you a flavour of my presentation style and content. For more, see Josh Simon’s writeup.

My main point is that although Solaris is a good place to be because it has a consistent track record of innovation (e.g. ONC, mmap, dynamic linking, audaciously scalable SMP, threads, doors, 64-bit, containers, large memory support, zones, ZFS, DTrace, …), the clincher is that these innovations meet in a robust package with long term compatability and support.

Linus may kid himself that ZFS is all Solaris has to offer, but the Linux community has been sincerely flattering Sun for years with its imitation and use of so many Solaris technologies. Yes, there is potential for this to work both ways, but until now the traffic has been mostly a one way street.

As a colleague recently pointed out it is worth considering questions like “what would Solaris be without the Linux interfaces it has adopted?” and “what would Linux be without the interfaces it has adopted from Sun?” (e.g. NFS, NIS, PAM, nsswitch.conf, ld.so.1, LD_*, /proc, doors, kernel slab allocator, …). Wow, isn’t sharing cool!

Solaris: often imitated, seldom bettered.

Technorati Tags: , , , ,

Silent Data Corruption, The Wicked Bible and ZFS

Are you concerned about silent data corruption? You should be. History shows that silent data corruption has potential to end your career!

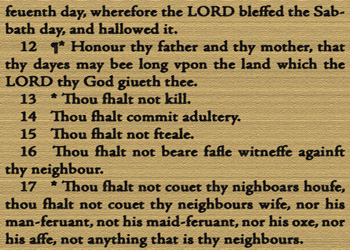
In 1631 printers introduced a single bit error into an edition of the King James Bible. They omitted an important “not” from Exodus 20:14, making the seventh commandment read “Thou shalt commit adultery.”

These unfortunate professionals were fined £300 (roughly a lifetime’s wages). Most of the copies of this “Wicked Bible” were recalled immediately, with only 11 copies known to exist today (source Wikipedia, image Urban Dictionary).

One of the problems with silent data corruption is that we may not even notice that is it there when we read the data back. Indeed, we may actually prefer the adulterated version. Happily the 1631 error stands out against the rest of the text in which it is found.

ZFS protects all its data (including metadata) with non-local checksums. This means that it is impossible for silent data corruption introduced anywhere between the dirty spinning stuff and your system memory to go unnoticed (what happens from there onwards is entirely up to you).

ZFS is able to repair corrupted data automatically provided you have configured mirrored or RAIDZ storage pools. It’s just a shame the British authorities didn’t take the ditto blocks in Deuteronomy 5:18 into account way back in 1631.

Hmmm, does that make the Bible prior art for United States Patent 20070106862?

Technorati Tags: , ,

ZFS: zee, zed or what?

“Sesame Street was brought to you today by the letter zee …” was probably the first time I was aware of a problem. Whilst I do try to contextualise my zees and zeds, sometimes the audience is just too diverse (or I am just too old). I am grateful to my French-Canadian friend and colleague Roch Bourbonnais for proposing an alternative. So “zer-eff-ess” it is, then! After all, ZFS really is zer one true filesystem, n’est-ce pas?

Technorati Tags: , ,

ZFS and RAID – “I” is for “Inexpensive” (sorry for any confusion)

When I were a lad “RAID” was always an acronym for “Redundant Array of Inexpensive Disks”. According to this Wikipedia article ’twas always thus. So, why do so many people think that the “I” stands for “Independent”?

Well, I guess part of the reason is that when companies started to build RAID products they soon discovered that were far from inexpensive. Stuff like fancy racking, redundant power supplies, large nonvolatile write caches, multipath I/O, high bandwith interconnects, and data path error protection simply don’t come cheap.

Then there’s the “two’s company, three’s a crowd” factor: reliability, performance, and low cost … pick any two. But just because the total RAID storage solution isn’t cheap, doesn’t necessarily mean that it cannot leverage inexpensive disk drives.

However, inexpensive disk drives (such as today’s commodity IDE and SATA products) provide a lot less in terms of data path protection than more expensive devices (such as premium FC and SCSI drives). So RAID has become a someone elitist, premium technology, rather than goodness for the masses.

Enter ZFS.

Because ZFS provides separate checksum protection of all filesystem data and meta data, even IDE drives be deployed to build simple RAID solutions with high data integrity. Indeed, ZFS’s checksumming protects the entire data path from the spinning brown stuff to the host computer’s memory.

This is why I rebuilt my home server around OpenSolaris using cheap non-ECC memory and low cost IDE drives. But ZFS also promises dramatically to reduce the cost of storage solutions for the datacentre. I’m sure we will see many more products like Sun’s X4500 “Thumper”.

ZFS – Restoring the “I” back in RAID

Technorati Tags: , , , ,

Lower power Solaris home server

78 Watts When my trusty Solaris 10 Atlhon 32-bit home server blew up I enlisted a power hungry dual socket Opteron workstation as a stop-gap emergency measure. I also used the opportunity to upgrade from SVM/UFS to ZFS. But the heat and the noise were unacceptable, so I started thinking about a quieter and greener alternative …

My initial intention was to build a simple ZFS-based NAS box, but after an abortive attempt to do things on the really cheap with a £20 mobo and £25 CPU (one of which didn’t work, and I’m still waiting for Ebuyer to process my RMA), I decided I needed to make an effort to keep up with the Gerhards.

Although I’d seen Chris Gerhard’s post about a system built around an ASUS M2NPV-VM, when I searched for this mobo at Insight UK (where Sun employees can get a useful discount, free next working day delivery, and expect to be treated as a valued customer), I was unable to find it. So instead, I opted for the cheaper ASUS M2V-MX (£38) … and soon regretted it.

My config also included: an Antec SLK3000B case (£29), a quiet Trust PW-5252 420W PSU (£19), an AMD Athlon 64 3000+ 1.8GHz 512K L2 CPU (£45), two Kingston ValueRAM 1GB 667 DDRII DIMMS (£52 each), and two Seagate Barracuda 400GB 7200.10 ATA100 drive (£82 each). I also threw in a spare 80GB SATA drive and DVD rewriter I just happened to have lying around. Grand total: £399.

However, despite upgrading to the latest firmware, I couldn’t get Casper’s PowerNow stuff to work. My disappontment grew whilst talking to Chris about his ASUS M2NPV-VM. Not only had he got PowerNow working (rev 0705 firmware minimum required), but the mobo included gigabit networking, NVIDIA graphics, and greater memory capacity.
By this time, feature creep had also set in. I could see that the machine might also be a useful workstation, and ZFS compression probably meant I could use as much CPU as I could get (sadly, the current version of Casper’s code supports only a single core config).

Then I discovered that Insight UK did indeed stock the ASUS M2NPV-VM after all! It’s just that their search engine is broken. So I decided to bite the bullet (£56) … I have since reused the ASUS M2V-MX in a dual core Ubuntu config, but that’s a story for another day … perhaps.

To find out how much power I was saving, I invested in a Brennenstuhl PM230 inline power meter (shown above). Machine Mart only wanted £20 for it, and unlike some other cheap units, it does a proper job with the power factor. The only issue I’ve found is the crazy positioning of the power outlet relative to the display and control buttons (it’s pretty obvious that UK power plugs were not considered in the original design). Anyway, here are some results:

Mode Config 2x Opteron 2.2GHZ
RioWorks HDAMB
2GB DDRII
6x 7200RPM
1x Athlon 64 1.8GHz
ASUS M2NPV-VM
2GB DDRII
3x 7200RPM
Intel Core Duo 1.83GHz
Apple MacBook Pro
2GB DDR2
1x 5400RPM
standby 40W (£23 PA) 4W (£2 PA) 7W (£4 PA)
idle 240W (£137 PA) 78W (£47 PA) 34W (£19 PA)
idle + charging 60W (£34 PA)
1 loop 260W (£149 PA) 111W (£64 PA) 50W (£29 PA)
2 loops 280W (£160 PA) 111W (£64 PA) 55W (£32 PA)
2 loops + charging 81W (£46 PA)

The above calculated annual electricity costs are based on a charge of 9p per kWh. Since a home server spends most of its time idle, I calculate that my new machine will save me at least £90 per year relative to my stop-gap Opteron system. That hardly pays for the upgrade, but it does salve my green conscience a little … just not much!

mbp$ ssh basket
Last login: Fri Apr 27 16:12:16 2007
Sun Microsystems Inc.   SunOS 5.11      snv_55  October 2007
basket$ prtdiag
System Configuration: System manufacturer System Product Name
BIOS Configuration: Phoenix Technologies, LTD ASUS M2NPV-VM ACPI BIOS Revision 0705 01/02/2007
==== Processor Sockets ====================================
Version                          Location Tag
-------------------------------- --------------------------
AMD Athlon(tm) 64 Processor 3000+ Socket AM2
==== Memory Device Sockets ================================
Type    Status Set Device Locator      Bank Locator
------- ------ --- ------------------- --------------------
unknown in use 0   A0                  Bank0/1
unknown empty  0   A1                  Bank2/3
unknown in use 0   A2                  Bank4/5
unknown empty  0   A3                  Bank6/7
==== On-Board Devices =====================================
==== Upgradeable Slots ====================================
ID  Status    Type             Description
--- --------- ---------------- ----------------------------
1   in use    PCI              PCI1
2   available PCI              PCI2
4   available PCI Express      PCIEX16
5   available PCI Express      PCIEX1_1
basket$

Technorati Tags: , , ,